Download
1 / 17

E N D
LINE BALANCING (Process Organization) Prepared by: Shaheen Sardar BSc Textile Engineering MS Textile Management Line Balancing Garment Manufacturing
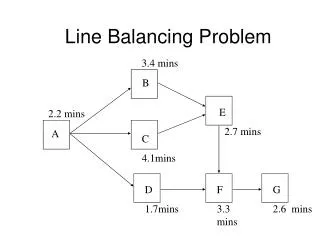
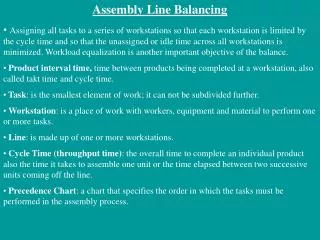
LINE BALANCING (Process Organization) The Line Balancing is “to design a smooth production flow by allotting processes to workers so as to allow each worker to complete the allotted workload within an even time”
LINE BALANCING (Process Organization) It is a system where you meet the production expectations and you can find the same amount of work in process in every operation at any point in the day.
Reasons to have balance the production line (1) Keeping inventory costs low results in higher net income (2) Keeping normal inventory levels lets the operator work all day long giving him/her the opportunity to earn more money by increasing his/her efficiency (3) Keeping the line balanced let’s the supervisors improve other areas because they can use their time better (4) Balanced production keeps prices low which turns into repeat sales (5) Balanced production means better production planning.
Balancing Tools The most basic tools are Production Sheets, the Daily production report, the inventory levels by operation and the Production Boards.
How do we start balancing the production line? Well we can start by determining how many operators for each operation are needed for a determined level of production. After this we need to determine how much WIP we need to anticipate production problems. Recommended WIP is 1-hour inventory level for each operation. A good range would be from 30 min to 120 min inventory level.
There are 3 rules for balancing: (1) Have at least ½ hour of WIP for each operation (2) Solve problems before they become any larger (3) Meet production goals by keeping every operator working at their maximum capacity
Work In Process (WIP) What is WIP? WIP is made up of all garments and their parts that are not completely finished.
How can we manage WIP? (1) Production planning (2) Trims control (3) Production Build-up (4) Balancing (5) Cut Flow Control
OUT PUT HIGH Balancing Matrix LOW WIP LOW
Pitch Time Reference value for synchronization in the division of labour is called Pitch Time (PT). Pitch Time provides average time allotted to each worker.
PITCH DIAGRAM (seconds) 160 Bottleneck Process 140 140 140 140 140 140 120 115 115 115 115 115 110 110 110 105 105 105 105 105 Work Allotment Time 100 80 95 95 95 140 140 140 140 140 80 60 70 40 20 A B C D E F G H Name of worker (In order of processes)
Bottleneck Process: The time at which the longest time is required is called “bottleneck Process” The state of line organization should be evaluated as “Organization Efficiency” Using the pitch time and Bottleneck Process Time. Pitch Time Organization Efficiency (%) = ________________________ x 100 Bottleneck Process Time 100 = ______ X 100 140 = 71.4 % (For the aforementioned case study)
Pitch Diagram in the form of Bar Graph 1st bottleneck Process Loss in balance 2nd bottleneck Process Loss in balance (Seconds) 160 140 120 1 4 0 100 Work Allotment Time 115 110 80 85 Work Allotment Time 1 0 5 95 60 70 80 40 20 A B C D E F G H Name of worker (in the order of processes) Pitch Diagram (bar graph)
How to reduce the number of bottleneck processes (1) Investigate the relation between the bottleneck process and its previous and subsequent processes to correct the line organization. (2) Investigate whether it is possible to further divide the process. (3) Conduct the motion study for work improvement. (4) Make improvements to equipment, jig and tools. (5) Mechanize the manual work. (6) Change the positions of workers. (7) Investigate the modification to the machining specifications. (8) Make it a rule to lend the worker in charge of the bottleneck process a helping hand
Control limit (seconds) 160 Bottleneck Process 140 140 140 140 140 140 140 Upper Limit 120 115 115 115 115 115 115 Work Allotment Time 110 110 110 110 105 105 105 105 105 105 100 80 Lower Limit 95 95 95 95 140 140 140 140 140 85 80 60 70 70 40 20 A B C D E F G H Name of worker (In order of processes)
Control limit Pitch Time Upper Limit = _________________________X 100 Target organization efficiency = 0.85 = 117.6 Seconds Lower Limit = 2 x Pitch Time – Upper Limit = 2 x 100 – 117.6 =82.4 Seconds