Download
1 / 24
240 likes | 387 Views
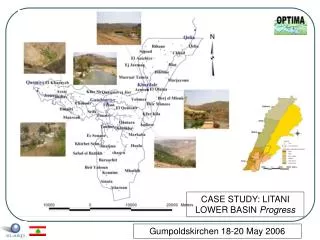
Colorado River Basin Supply and Demand Study What’s Normal and What’s New?. Disclaimer.

E N D
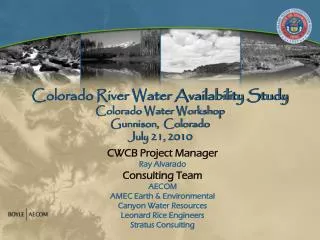
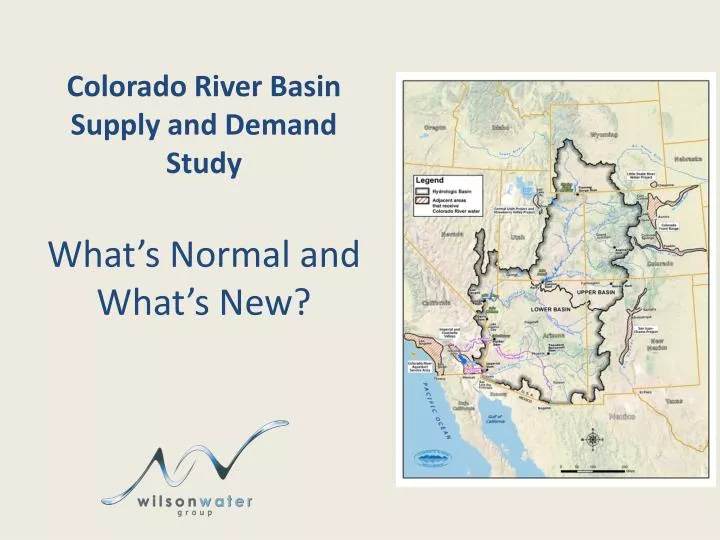
Colorado River Basin Supply and Demand StudyWhat’s Normal and What’s New?
Disclaimer The views presented are my interpretation of the results and important issues from the Colorado River Basin Supply and Demand Study. These views do not represent the official views of the Colorado Water Conservation Board, the Colorado Attorney General’s Office, the Colorado Division of Water Resources, the Colorado River District, the Southwest Water Conservation District, the Front Range Water Council, the [insert name here]…….
Colorado River Basin Study Purpose • Define future imbalances in the water supply and demand for Colorado River water • Analyze adaptation and mitigation strategies to resolve those imbalances • Study report is not a decisional documentbut is considered a call to action for next steps
* Upper Basin Includes 0.5 MAF of CRSP Evaporation Lower Basin Includes 1.2 MAF of Evaporation
“Normal” for Colorado/ Upper Basin • Colorado and Upper Division Projected demands do not reach Full Apportionment by 2060 • Colorado and Upper Division Projected demands are higher than actual depletions • Lower Division demands exceed Apportionment currently
Annual Observed Natural FlowColorado River at Lees Ferry Ranges from 5.5 MAF to 25 MAFMean Annual Flow (1906 to 2008) = 15 MAF Mean Annual Flow (1991 to 2010) = 13.7 MAF Mean Annual Flow (1951 to 1970) = 13.2 MAF
Annual Climate Projected Natural FlowColorado River at Lees Ferry GCMs Annual Flows Range from 4.2 MAF to 44 MAFAverage Mean Annual Flow for all 112 GCMs = 13.7 MAF 25% of GCMs predict Mean Annual Flow > 15.0 MAF25% of GCMs predict Mean Annual Flow < 12.5 MAF
“Normal” for Colorado/Upper Basin • Planning for hydrologic variability and prolonged drought is normal • Risk of Lee Ferry Deficit was considered during the Compact negotiations • Historical Climate Variability is why the CRSP Reservoirs were built
“Normal” for Colorado/ Upper Basin • Shortages in the Upper Basin are primarily due to limited supply, and are nothing new • Colorado water users understand risk • Tributary agricultural users are supply-limited in the late irrigation season nearly every year
New Normal • Upper Basin is experienced at planning/ adapting to variable climate and risk • Lower Basin may not be as “seasoned” • About ½ of the GCMs result in at least 1 year of Lee Ferry Deficit between 2040 and 2060 • Climate change vs prolonged drought and climate variability creates more urgency
New Normal • Global climate modeling is a new and rapidly changing science
Key Metrics for Colorado • Lee Ferry Deficit • Indicates Risk associated with development of Compact Entitlement • Upper Basin Shortages • Indicates Supply for consumptive uses • Flows at Critical Locations • Indicates Supply for non-consumptive needs
Options to Mitigate Imbalances • Options and Strategies investigated • Increase Supply • Reduce Demand • Modify Operations
Indicator Metrics and Signposts A good Signpost anticipates a vulnerable conditions, but does not triggeraction unnecessarily. Anticipating a potential Lee Ferry Deficit is the key to responsible future development.
Normal Options • Large Scale Import Options and Strategies provide largest benefit • Desalination from the Pacific Ocean and imports from other rivers would require long lead-times to permit • Conservation and Reuse • Upper Basin imbalances are not significant; “Normal” Options and Strategies primarily benefit the Lower Basin
New Normal Options • Upper Basin Water Banking Option was proposed by Conservation Groups primarily for environmental/recreational flows • Water Banking could mitigate a potential Lee Ferry Deficit • Water Banking is being further considered in Basin Study Next Steps, by Colorado, and by the Upper Basin States
Next Steps for Colorado • Adopt Signpost Approach • In lieu of spending effort determining probability of a Lee Ferry Deficit • Refine the signposts • Build the technical, legal, and policy requirements to implement Options and Strategies when needed • Support the Lower Basin to find solutions to their over-apportionment issues
Next Steps for Colorado • Provide Support for Data Development • Continue to support Climate Science Research – not to identify probabilities, but to understand the future range of possibilities • Support Conservation Studies to look realistically at how much demand reduction is possible • Help Study Team understand legal and policy implications associated with Conservation, Reuse, and Water Banking
Colorado’s Challenges • Drama makes the news • “Study shows a 3.2 MAF imbalance in the Colorado River”. Once published, this became the tag-line. • No recognition in the Study that imbalances assume Lower Basin can develop their projected demands well beyond apportionments. • No recognition in the Study that Upper Basin has always experienced shortages
Colorado’s Challenges • Results can be “picked” to make any point • “Climate-change projections show 10 to 30 percent less water in the river by 2050.” (Denver Post, American Rivers) • Only if you select the driest of the 112 GCMs • All 112 projections range from 20 percent more to 30 percent less water • Context is important when reading articles/white papers published by advocacy groups
“Normal” for Colorado/ Upper Basin • Study does NOT indicate an immediate crisis for Colorado, however does highlight the continued importance of continuing to considering the Risk of a Lee Ferry Deficit associated with both current use and future development