Download
1 / 13
130 likes | 224 Views
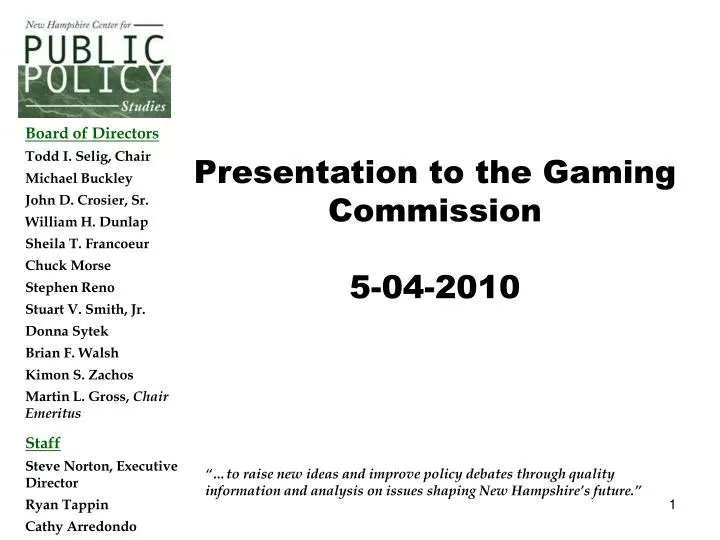
Presentation to the Gaming Commission 5-04-2010. Board of Directors Todd I. Selig, Chair Michael Buckley John D. Crosier, Sr. William H. Dunlap Sheila T. Francoeur Chuck Morse Stephen Reno Stuart V. Smith, Jr. Donna Sytek Brian F. Walsh Kimon S. Zachos Martin L. Gross, Chair Emeritus

E N D
Presentation to the Gaming Commission5-04-2010 Board of Directors Todd I. Selig, Chair Michael Buckley John D. Crosier, Sr. William H. Dunlap Sheila T. Francoeur Chuck Morse Stephen Reno Stuart V. Smith, Jr. Donna Sytek Brian F. Walsh Kimon S. Zachos Martin L. Gross, Chair Emeritus Staff Steve Norton, Executive Director Ryan Tappin Cathy Arredondo “…to raise new ideas and improve policy debates through quality information and analysis on issues shaping New Hampshire’s future.”
Four Topics • Center’s External Review Process • Report Release • Saturation Model Results • Model Refinements Based on Input to Date
External Review • Reviewers agreed to assess and provide input without ‘supporting or not supporting’ the issue of gambling. • Eight external reviewers identified • Public health • NH Policy • Economists • University-based gambling specialists • Business professors
Fundamental Model Assumptions • The placement of a casino in New Hampshire (or closer to New Hampshire) will increase the number of people that gamble. • The farther individuals have to travel, the less likely they are to go to a casino in New Hampshire. And … the closer you are to a casino, the more likely you are to go to a casino. • Gravity of a facility – attractiveness, size, amenities – and the competition in the market affects gambling behavior. • For a small share of the population, exposure to gambling results in pathological behavior. • This creates a set of social issues which – if they can be quantified -- are offsets to the potential benefits.
Center’s Model of Expanded Gambling • Take as Inputs • Location • Size • Type • Massachusetts Action • Produce as Outputs • Economic (jobs, product) • Net Revenue • Crime • Social Costs to NH and local communities • 5 Scenarios • North Woods • Southern NH • Ski Country • Southwestern NH • Lakes Region Sites IDed by Commission to give a sense of the impact of location. Model can be used to simulate other sites.
Putting It All Together Markets? Standard Economic Development Models Standard Retail Gravity Model Adjusted to Reflect NH Experience Long Term (Operation of Facility) # of Gamblers and Intensity Short Term (Construction) # of New Problem /Pathological Gamblers New Gambling Tax Dollars Direct/ Indirect Direct/ Indirect Costs of Problem/ Pathological Gamblers Meals and Rooms, Lottery Impact Displacement Societal Costs (Govt and Non-Govt) Net Impact Net Impact
Net Benefit: Southern NH Preliminary Results
Saturation Model • Understanding saturation levels requires assumptions about site placement and size and games offered. • Difficult to simulate the ‘slot on every corner’ approach adopted in West Virginia. • Our approach? Estimate unique gambling markets in New Hampshire, and also minimize “double counting” • Identify non-overlapping markets to assess saturation. • Use 60 minute drive times as edge of each market • Assume large facility ($500m at each site in terms of gravity, etc…)
The Saturation Model Preliminary Results
Comparing Net-BenefitSaturation with 5 sites vs Other Options • Comparing saturation to the other single highest revenue option (Southern NH) • Revenue Comparison excluding social costs • Southern New Hampshire Revenues, Netting out impact of Massachusetts decision – estimated $153m • Saturation Model Revenues, Netting out impact of Massachusetts decision – estimated $192m • Revenue comparison including social costs • Southern New Hampshire Revenues, estimated $93 million • Saturation Model Revenues, estimated $86 million • When including social costs, net benefit to state is lower in the saturation model due to the fact that all of the projected social costs are born by New Hampshire for non-border sites. • Calls into question whether many sites would add significant revenue or benefits -- other than local economic development – to the state.
Anticipated Model Refinements • Revenue Estimation • Recession’s Impact. What happens if our assumptions are too high? • Lottery revenues declined by 16% between 2008 and 2010. • Gambling revenues in Nevada fell 10.4 percent in 2009, the largest single-year decline in state history • Economic Development • Use only RIMs in simulation of economic development, but note in report the impact of using REMI. • Wage assumptions Have not addressed issues of tips • Have not included wage changes due to difficulty in assessing actual impact (given ability to pay below minimum wage in NH). • Assumes ‘prevailing wage’
Next Steps • Report finalization • External Review • Internal Review (Standard Operating Procedure) • Release (2nd half of May)