Download
1 / 4
40 likes | 193 Views
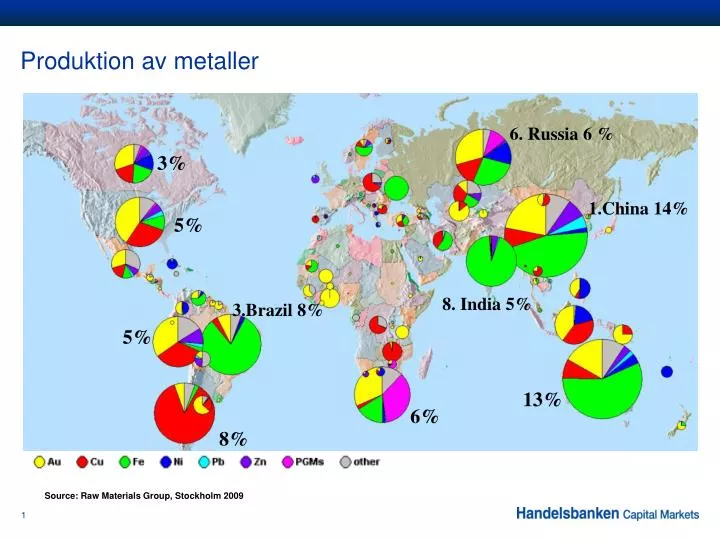
Produktion av metaller. 6. Russia 6 %. 3%. 1.China 14%. 5%. 8. India 5%. 3.Brazil 8%. 5%. 13%. 6%. 8%. Source: Raw Materials Group, Stockholm 2009. Konsumtion av metaller. Ryssland 3%. Tyskland 4%. USA 7.8%. Kina 46%. Japan 5.6%. Syd Korea4%. Indien 3.3%. Brasilien 2%.

E N D
Produktion av metaller 6. Russia 6 % 3% 1.China 14% 5% 8. India 5% 3.Brazil 8% 5% 13% 6% 8% Source: Raw Materials Group, Stockholm 2009
Konsumtion av metaller Ryssland 3% Tyskland 4% USA 7.8% Kina 46% Japan 5.6% Syd Korea4% Indien 3.3% Brasilien 2% Source: WBMS, WSA , RMG and Handelsbanken Capital Markets
Produktion av olja Norway 3% Russia 12,7% USA 9 % China 4,8% Kuwait 3% UAE 3,3% Nigeria 2,6% Saudi 12,3% Venezuela 3% Angola 2,3% Source: Raw Materials Group, Handelsbanken Capital Markets
Konsumtion av olja Russia 3.4% Germany 3.1% USA 23.8 % China 11.4% Saudi 3,3% India 4.1% Brazil 3.1% Source: Raw Materials Group, Handelsbanken Capital Markets