Download
1 / 46
480 likes | 705 Views
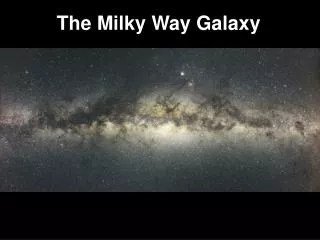
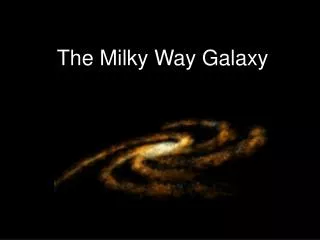
The Milky Way Galaxy. Overview & History. Our Galaxy is a collection of stellar and interstellar matter – stars, gas, dust, neutron stars, black holes – held together by gravity. Our view of the Galaxy…. History of Galactic (& Extragalactic) Astronomy.

E N D
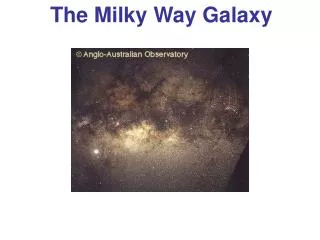
Overview & History • Our Galaxy is a collection of stellar and interstellar matter – stars, gas, dust, neutron stars, black holes – held together by gravity. • Our view of the Galaxy….
History of Galactic (& Extragalactic) Astronomy • 1610 -Galileo discovered the Milky Way is comprised of many stars • 1755 - Immanuel Kant theorized that the galaxy has a planar structure, some nebulae might actually be entire other galaxies or island universes • 1774 -1781 - Messier catalog compiled including Andromeda galaxy as M31 • 1781-1802 - William and Caroline Herschel conducted first “all-sky survey” and cataloged 5000 nebulae, resolving some into their individual stars • Later (1845) William Parsons (Lord Rosse), using a 72-inch telescope, classified the nebulae into featureless ellipticals and whirlpool-like spiral nebulae • Much later (1888) Dreyer would add to their list to create the New General Catalog (NGC) and Index Catalog (IC)
1785 - Herschel attempted to determine the shape and size of Galaxy Assumptions: • All stars have same intrinsic brightness • Star are arranged uniformly throughout the MW • He could see to the edge of the system • then dmax = 100.2(m_max-M+5) SUN Herschel could not account well for the effects of dust. More dust along the disk causes the distribution of stars to drop-off artificially – objects more than a few kpc from the Sun are obscured by dust.
Early 1900’s - Kapteyn used stellar parallax to estimate the true size of the Galaxy Kapteyn Universe • 10kpc diameter and 2kpc thick with the Sun less than a kpc from the center (rather heliocentric) • Tried to estimate Rayleigh scattering due to ISM gas but determined it to be insignificant (because most obscuration is due to ISM dust absorption which has a smaller dependence) • Shapley (1919) noted that globular clusters are distributed asymmetrically in the sky and that if one assumes they are distributed about the center of the galaxy, this implies the Sun in not near the center • Estimated distances to GCs using variable stars and P-M relationship • Concluded size to be 100kpc with Sun 15kpc from center • Still wrong…didn’t account for dust absorption which makes things look further away
In 1920, the National Academy of Science hosted the Great Debate concerning the nature of the Spiral Nebulae: were they island universes outside of the MW? • Shapley had MW size too big and therefore argued “NO”, they are part of MW • Curtis (and many others at that time) believed the Kapteyn model of a much smaller MW and argued “YES”, they are separate galaxies beyond the extent of the MW. His notes about a variable star Subsequent claims that the SMC and LMC are about 32-34 kpc away In 1922-1924 Edwin Hubble resolved the controversy using the superior 100-inch telescope at Mount Wilson. He observed Cepheid variables in Andromeda and, using the P-M relation, determined its distance at 300kpc -- well outside of the MW (still off by a factor of 2 due to poor Cepheid calibrations) Note the date: 6 Oct 1923
Also in the early 1900’s, Lindblad was doing the first kinematic studies of the MW • Estimated mass in MW from all stars in Kapteyn’s model • Determined velocities of GCs to be as high as 250 km/s - much higher than escape velocity of Kapteyn model • Lindblad (1927) developed first detailed kinematic model of MW • Spherical component with random motions - HALO • Flattened component with rotational motion - DISK • Measured disk to rotate at 200 to 300 km/s near Sun Oort (1927,1928) developed a complete theory of Galactic stellar kinematics
In 1944, Baade used the 100-inch Mount Wilson telescope to resolve stars in the inner regions of nearby spirals and elliptical galaxies. • Spiral spheroids and Ellipticals contain red giant stars • Spiral arms in disks contain blue supergiants • Population I: blue stars and open clusters accompanied by gas and dust in the disks of spiral galaxies • Population II: red stars and globular clusters in spheroids and elliptical galaxies • Plotting stars on HR diagrams showed that the populations also differed in age and it was subsequently determined that they differed in metallicity: • Pop I young and metal rich • Pop II old and metal poor
Components of the Milky Way • Disk • Population I stars • Open clusters • HII regions • Bulge • Population II stars • Halo • Globular clusters
What MWG might look like as seen from above, based on recent data from the Spitzer Space Telescope (infrared)
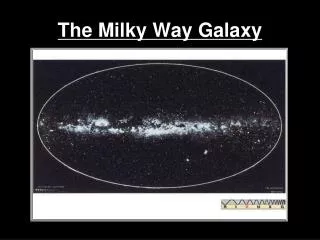
Globular Clusters in our Galaxy Shapley realized that the GCs map out the true extent of our galaxy! Galactic Halo The hub of the galaxy is the Galactic Center - about 8 kpc from the Sun Actual size of the Galaxy and the Sun’s location not fully determined until 1950’s
The Halo “senior citizens”; very few newborns old, red and dim; much smaller than Sun Far fewer heavy elements than Sun (< 0.02%) Lack of chem. Enrichment – stars formed early in MWG history before many supernovae explosions Very few detectable molecular clouds; virtually gas-free Lack of gas caused star formation to cease early on
Our neighborhood - More active than halo; typifies much of galactic disk - Within 33 l.y. (10 pc) are over 300 stars - Most are dim, red type M - A few (Sirius, Vega, Altair, Fomalhaut) are bright, white stars younger than Sun - No very massive, short-lived stars (type O or B) - We are in a quiet “suburb,” but it was not always that way. - Hot X-Ray emitting gas coming from nearby in all directions. Surrounding hot gas is region of cooler gas (100 light years distant) - We and all our stellar neighbors live inside a hot bubble! - The existence of this LOCAL BUBBLE means that a number of supernovae must have detonated within our stellar neighborhood over past several million years! -
Hot Star Hangouts - Hot, massive stars live fast and die young; never get far from the molecular cloud from which they were formed. Therefore, they are found in clusters close to molecular clouds - IONIZATION NEBULAE (colorful, wispy glowing gas) found throughout galactic disk, particularly in spiral arms Also called EMISSION NEBULAE or H II (abbrev. For ionized Hydrogen) - Energy that powers H II comes from nearby hot stars that irradiate them with UV photons, which ionize and excite the atoms causing them to emit light - The Orion Nebula is the most famous example (p. 555)
Differential Rotation • Everything in the Galaxy orbits around the Galactic center • Material closer to the center travels on faster orbits (takes less time to make one full orbit) • Similar to the way the planets orbit the Sun • Orbital periods at different distances from GC tell us the distribution of mass in the Galaxy
The Milky Way in motion- Halo - Chaos of stars soaring on randomly oriented orbits - Disk – organized “stately” rotation - All stars in disk orbit in same direction like a merry-go-round - Individual stars bob up and down as they orbit - The up and down motions spread the disk to a width of about 1,000 l.y. - Diameter of the disk is much, much larger – 100,000 l.y. - Orbits of stars in halo and disk are much less organized - Arcturus – 4th brightest star in sky is a halo star
- Sun’s orbital path is called the SOLAR CIRCLE - Its radius is 28,000 from the galactic center - By measuring the speed of globular clusters relative to the Sun, it has been determined that the Sun (and its neighbors) orbit the center of the Galaxy at a speed of 220 km/sec - It takes the Sun 230 million years to do one orbit - The last time the Sun was on this side of the Galaxy, dinosaurs ruled the Earth
Slight Aside on Determining Distances • We get distances to nearby planets from radar ranging. • That sets the scale for the whole solar system (1 AU). • Given 1 AU plus stellar parallax, we find distances to “nearby” stars. • Use these nearby stars, with known Distances, Fluxes and Luminosities, to calibrate Luminosity classes in HR diagram. • Then spectral class + Flux yields Luminosity + Distance for farther stars (Spectroscopic Parallax). • Cepheids (variable stars) use P-M relation to determined distances to nearby galaxies
Henrietta Leavitt & the Cepheid P-L Relationshipsee original paper: here Light curve of a Cepheid variable Large & Small Magellaic Clouds Period versus magnitude of Cepheids in SMC
1923 - Hubble Measures Distance to M 31 using Cepheid Variables Debate OVER! Discovery of Cepheids in M 31 100-inch Hooker Telescope, Mt. Wilson Edwin Hubble
Luminosity 4d2 Flux = The HR Diagram: Spectroscopic “Parallax” Example: 1) Determine Temperature from color or spectral type. 2) Determine Luminosity based on Main Sequence position. Main Sequence 3) Compare Luminosity with Flux (apparent brightness). 4) Use inverse square law to determine distance.
The HR Diagram: Luminosity & Spectroscopic Parallax A star Supergiant A star Giant A star Dwarf(Main Sequence) Wavelength What if the star doesn’t happen to lie on the Main Sequence - maybe it is a red giant or white dwarf??? We determine the star’s Luminosity Class based on its spectral line widths: Spectral lines get broader when the stellar gas is at higher densities -indicates smaller star.
Bright Supergiants Supergiants Bright Giants Giants Sub-giants Main-Sequence (Dwarfs) The HR Diagram: Luminosity Class
Distribution of Gas • To understand star formation on a galactic scale, we need to know how the interstellar gas is distributed • Radial distribution? • Degree of confinement to the disk? • Constant thickness? • Is galactic plane truly flat or bumpy?
“Dust Happened” At visible wavelengths, the center of our galaxy suffers ~ 30 mag of extinction by dust!! Even with big modern telescopes, we cannot see very far in the plane of our galaxy at visible wavelengths
It is the hot, young massive stars that trace out the spiral structure Galaxy Evolution Explorer (GALEX) sees UV light
Distribution of mass in the Milky Way Galaxy - ROTATION CURVE – plots rotational velocity vs. distance from center - Merry-go-round – outer horses make larger circles and thus travel faster than inner horses. Opposite is true for Solar System rotation curve – inner planets move at faster speeds than outer planets (because most of SS mass in the Sun) - Rotation curve for MWG is mysterious - Most of mass of MWG is in the halo - Halo might outweigh all of the disks stars by a factor of 10- however, only a small number of halo stars? - Much of the halo’s mass is in the form of DARK MATTER - If the more distant stars orbit faster – shouldn’t the spiral arms look like a tightly- wound coil?? (pp. 560-562)
Spiral Structure • Many external galaxies show spiral structure • Hard to “see” morphology of MW (since we are in it!) • Use other galaxy’s properties to determine the nature of the WM and conclude we are in a spiral galaxy
Rotation Curve of MWG - v is almost constant or slightly increasing with distance from center! Most other galaxies have similar rotations curves. Dilemma!! This requires that mass is distributed far out in these galaxies, but images seem to show that stars aren’t doing this! - DARK MATTER!
In other galaxies, HII regions and OB associations trace out spiral arms. • • Using spectroscopic parallax, we can place the nearby O and B stars at their proper distances. • • They appear to delineate spiral arms. • • Since O and B stars are young objects, spiral arms are associated with star formation. • Problem: Can’t see very far in the optical…
Large scale surveys of CO in the Galaxy identify many Giant Molecular Clouds. If spiral arms are associated with star formation, then they must also be traced out by the locations of GMCs. • GMC positions interior to Sun’s orbit in Galaxy have some ambiguity • Bits and pieces of arms • Less distance ambiguity outside of Solar orbit, and better evidence of arm-like morphology
The Galactic Center • Inner 500pc of Galaxy • Extinction makes optical studies impossible - use radio or IR • Observe ionized gas, line emission, dust, star clusters • Resolution greatly improved with VLA and VLBI observatories, plus sensitive IR arrays
- The center of the MWG lies in the constellation Sagittarius. - Interstellar dust prevents us from seeing how bright this region actually is - The Milky Way is transparent to long-wavelength radiation (infrared, radio) so those types of radiation are used to study the galactic center. - Swirling clouds of gas and a cluster of several million stars - Bright radio emission traces out magnetic fields that thread this region - In the core of it sits an even brighter radio emission called Sagittarius A (SgrA)
- The motions of gas and stars in SgrA indicate that it contains a few million solar masses in a region no bigger than 3 light-years. - Astronomers suspect SgrA is a black hole weighing 2.5 million solar masses; this is like no other observed black hole. - Other black hole candidates like Cygnus X-1 accrete matter from their companions and radiate brightly in X-Rays. SgrA radiates only very faint X-Rays - Many other observed galaxies have strong X-ray emissions from their centers - Explanation #1: possible that SgrA contains a huge black hole that has “run out of gas” to accrete - Explanation #2: possible that it might be consuming the energy contained in the accreting matter before it has a chance to escape as radiation - The nature of SgrA remains mysterious
Galactic Center: Radio Schematic 75pc 150pc
Radio emission shows bent arc of gas, filamentary structure • Also seen in IR • Thermal and synchrotron radiation • X-ray emission (produced when electrons from filaments collide with colder gas cloud) gives gas temperatures of T=107 to 108 K • Could result from past SN explosions
Star Formation in the Galactic Center • Molecular material in inner 200pc relatively hot and dense: 104 per cm3 and 70 K • High velocity dispersion (50 km/s) of molecules • Mass: 108 Msun • High density helps star formation but high temps don’t • SF rate ~ 1Msun/year
Supermassive Black Hole in GC Radio image (10 pc across) shows feature known as SgrA* - thought to be position of SMBH Radio image (80 pc across) shows feature SgrA and radio filaments Investigate IR stellar motions in region about 1pc across (~few ly) to estimate BH mass
Measure proper motions of stars in GC • Adaptive optics at Keck improved ground-based resolution to 0.5” in IR (stellar positions measured to 0.002”) • 90 stars identified and proper motions (largest at 1400 km/s!) centered about SgrA* to within 0.1” • Velocities consistent with Keplarian motion (all mass at center) • M = 2.6 +/- 0.2 x 10⁶ Msun
Additional evidence - x-ray emission • Chandra X-ray image of Sgr A* showing nucleus and several thousand other X-ray sources. • During 2-week observation period, several X-ray flares occurred. • Rapidity of flares indicates they originate near the Schwarzchild radius of the BH. • Even during the flares, X-ray emission from the nucleus is relatively weak. Suggests that Sgr A* is a starved black hole, possibly because explosive events in the past have cleared much of the gas from around it. Curvature of the paths near SgrA* constrain the volume of the mass to ~ Schwarzchild radius (few x 106 km), supporting SMBH theory.