Download

1 / 9
100 likes | 491 Views
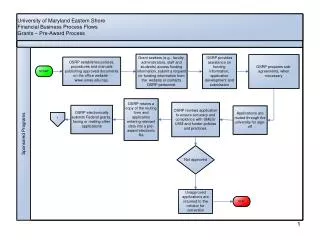
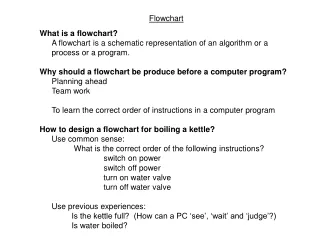
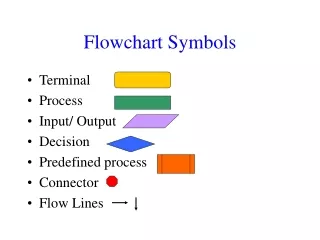
Flowchart. Flowchart:. It is a diagram consists of symbolic block that represents the algorithm step by step Symbols of flowchart: Terminal (start, stop) Input / output Processing Flow: concerned with direction Decision: for logic comparison Connector Off-page connector. start.

E N D
Flowchart: It is a diagram consists of symbolic block that represents the algorithm step by step Symbols of flowchart: • Terminal (start, stop) • Input / output • Processing • Flow: concerned with direction • Decision: for logic comparison • Connector • Off-page connector
start Read name, mark New_mark = mark+5 • print name, new_mark stop Flowchart: Ex: draw the flowchart for this algorithm: • Begin • startstopRead name, markprint name, new_markNew_mark = mark+5 • input name, mark • new_mark = mark+5 • print name, new_mark • End
start studentcount =1 A studentcount <= 10 stop Read name, mark new_mark = mark + 5 print name, new_mark studentcount = studentcount +1 A Flowchart: Ex: draw the flowchart for this algorithm: • Begin • studentcount =1 • if studentcount > 10 then Stop else • read name, mark • calculate new_mark = mark + 5 • print name, new_mark • studentcount = studentcount +1 • goto step 3
start Read x, y, L yes L< 0 x2 –y + x No yes L=0 2x + y No (x / y) + 10 Write F stop Flowchart: Ex: Draw a flowchart to compute: F = x2 –y + x L<0 2x + y L=0 (x / y) + 10 L>0 • start • read x, y, L • if (L<0) then F = x2 –y + x else if (L=0) then F = 2x + y else F = (x / y) + 10 • write F • stop
A start yes No Read n Read n I<=n yes Read x Max<x Max = x stop No Max=x Min=x yes Min>x Min = x No I = 2 I = I +1 b A b Flowchart: Ex: Trace the following flowchart to find the value of max and min variable for 4 numbers order as follows (x = 4, 2, 1, 3)?
Flowchart: Ex: Read name for student, when name="xxx" stop the program, if name does not equal "xxx" then compute the grade of every student. Every student has five courses. The average for the student courses has to be computed and there by the grade is given. Avg > = 90 ------------------------> grade = 'A' 80 < =Avg < 90 ------------------------> grade = 'B' 70 < =Avg < 80 ------------------------> grade = 'C' 60 < =Avg < 70 ------------------------> grade = 'D' Avg < 60 ------------------------> grade = 'F'
Sol: • Start • read name • while (name != "xxx") do • begin • total = 0 • for count = 0 to 5 do • begin • read mark • total = total + mark • end • avg = total / 5 • if ( avg >= 90) then grade = 'A' else if ((avg >=80) and (avg < 90)) then grade = 'B' else if ((avg >=70) and (avg < 80)) then grade = 'C' else if ((avg >=60) and (avg < 70)) then grade = 'D' else Grade = 'F' • Write name, grade • read name • end • stop
A start C yes total= 0 Count= 0 avg > = 90 Grade='A' Read name No B ((avg >=80) and (avg < 90)) yes Grade='B' Name = "xxx" yes No Read mark stop No total= total + mark ((avg >=70) and (avg < 80) yes Grade='C' count= count + 1 yes No count < 5 No B avg = total / 5 ((avg >=60) and (avg < 70)) yes Grade='D' A No Grade='F' Write name, grade C