Download
1 / 23
230 likes | 295 Views
Evidence of CSUN’s Educational Effectiveness: Selected Data Sources. Bettina J. Huber Director of Institutional Research Preparing for the Second WASC Site Visit 9 September 2011. Overview. Gains in Undergraduate Persistence Transfer Students First Time Freshmen

E N D
Evidence of CSUN’s Educational Effectiveness: Selected Data Sources Bettina J. Huber Director of Institutional Research Preparing for the Second WASC Site Visit 9 September 2011
Overview • Gains in Undergraduate Persistence • Transfer Students • First Time Freshmen • Talking to the WASC Visitors
A Comparative View of Persistence at CSUN • Data Sources • Multi-year campus-specific CRSDE persistence data • Multi-year CSU data on FTF proficiency at entry • Persistence Measures Examined • One-year continuation rates • Proficiency at entry (FTF only) • Graduation rates (6 years for FTF; 3 years for FTT) • Likely graduates: students who have graduated or are still enrolled at a fixed point after entry (e.g., 3 years or 6 years)
A Comparative View of Persistence at CSUN • CSU Campus Groupings Examined • The system as a whole • Large campuses (n=6) • Los Angeles Basin campuses (n=5) • Subgroups Examined • Two gender groups • Four racial and ethnic groups
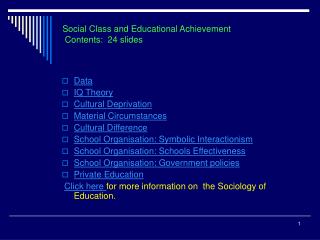
Racial and Ethnic Subgroups Considered • Traditionally Underserved Students • American Indian • Pacific Islander • African American • Latina/o • Better Served Students • Asian • White • Other and Unknown
Figure 10. Campus-Specific One-Year Continuation Rates for All Freshmen by Proficiency in Math at Entry (Fall 2005-07 Cohort Averages)
Key Data Points: Transfer Students • Have among the highest three-year and likely graduation rates in the CSU • Have among the highest one-year continuation rates in the CSU • Traditionally underserved and better served students perform equally well
Key Data Points: First Time Freshmen • Strong gains in persistence to graduation during the last decade • Traditionally underserved students have gained disproportionately, but still lag better served • CSUN freshman graduation rates remain among the lowest in the system • The one-year continuation rate has declined in recent years • The continuation rate remains among the lowest in the system
We must help our poor freshmen! We are failing them!