Download
1 / 137
1.37k likes | 1.39k Views
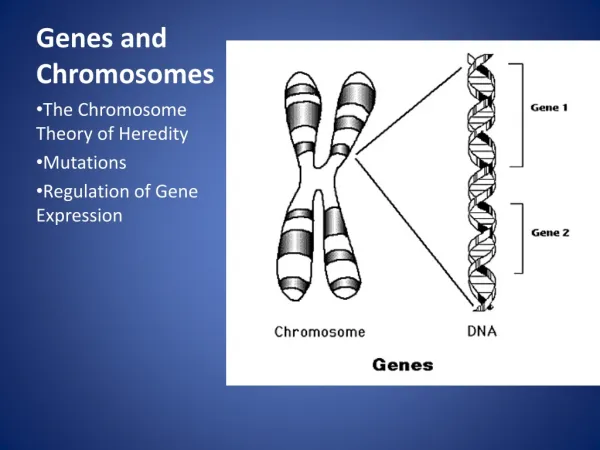
Genes and Variation. This group of ladybug beetles illustrates a population with a number of inherited traits Darwin recognized such variations as the raw material for evolution. Genes and Variation. Genes and Variation.

E N D
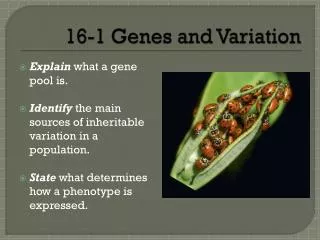
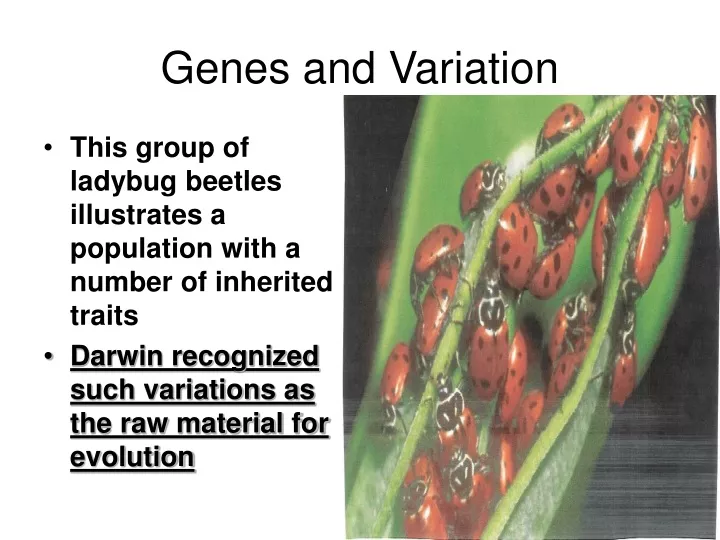
Genes and Variation • This group of ladybug beetles illustrates a population with a number of inherited traits • Darwin recognized such variations as the raw material for evolution
Genes and Variation • As Darwin developed his theory of evolution, he worked under a serious handicap • He didn't know how heredity worked! • Although Mendel's work on inheritance in peas was published during Darwin's lifetime, its importance wasn't recognized for decades • This lack of knowledge left two big gaps in Darwin's thinking • First, he had no idea how heritable traits pass from one generation to the next • Second, although variation in heritable traits was central to Darwin's theory, he had no idea how that variation appeared
Genes and Variation • Evolutionary biologists connected Mendel's work to Darwin's during the 1930s • By then, biologists understood that genes control heritable traits • They soon realized that changes in genes produce heritable variation on which natural selection can operate • Genes became the focus of new hypotheses and experiments aimed at understanding evolutionary change • Another revolution in evolutionary thought began with Watson and Crick's studies on DNA • Their model of the DNA molecule helped evolutionary biologists because it demonstrated the molecular nature of mutation and genetic variation
Genes and Variation • Today, molecular techniques are used to test hypotheses about how heritable variation appears and how natural selection operates on that variation • Fitness, adaptation, species, and evolutionary change are now defined in genetic terms • We understand how evolution works better than Darwin ever could, beginning with heritable variation
How Common Is Genetic Variation? • We now know that many genes have at least two forms, or alleles • Animals such as horses, dogs, and mice often have several alleles for traits such as body size or coat color • Plants, such as peas, often have several alleles for flower color • All organisms have additional genetic variation that is “invisible” because it involves small differences in biochemical processes • In addition, an individual organism is heterozygous for many genes • An insect may be heterozygous for as many as 15 percent of its genes • Individual fishes, reptiles, and mammals are typically heterozygous for between 4 and 8 percent of their genes
Variation and Gene Pools • Genetic variation is studied in populations • A population is a group of individuals of the same species that interbreed • Because members of a population interbreed, they share a common group of genes called a gene pool • A gene poolconsists of all genes, including all the different alleles, that are present in a population
Variation and Gene Pools • The relative frequency of an allele is the number of times that the allele occurs in a gene pool, compared with the number of times other alleles for the same gene occur • Relative frequency is often expressed as a percentage • Example: • In the mouse population in the figure at right, the relative frequency of the dominant B allele (black fur) is 40 percent, and the relative frequency of the recessive b allele (brown fur) is 60 percent • The relative frequency of an allele has nothing to do with whether the allele is dominant or recessive • In this particular mouse population, the recessive allele occurs more frequently than the dominant allele
Variation and Gene Pools • When scientists determine whether a population is evolving, they may look at the sum of the population’s alleles, or its gene pool • This diagram shows the gene pool for fur color in a population of mice • Here, in a total of 50 alleles, 20 alleles are B (black), and 30 are b (brown) • How many of each allele would be present in a total of 100 alleles?
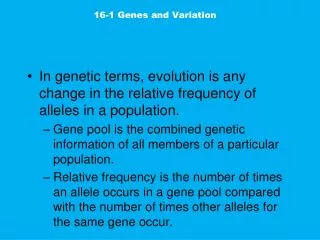
Variation and Gene Pools • Gene pools are important to evolutionary theory, because evolution involves changes in populations over time • In genetic terms, evolution is any change in the relative frequency of alleles in a population • For example, if the relative frequency of the B allele in the mouse population changed over time to 30 percent, the population is evolving
Sources of Genetic Variation • Biologists can now explain how variation is produced: • The two main sources of genetic variation are mutations and the genetic shuffling that results from sexual reproduction
Mutations • A mutation is any change in a sequence of DNA • Mutations can occur because of mistakes in the replication of DNA or as a result of radiation or chemicals in the environment • Mutations do not always affect an organism's phenotype—its physical, behavioral, and biochemical characteristics • For example, a DNA codon altered from GGA to GGU will still code for the same amino acid, glycine • That mutation has no effect on phenotype • Many mutations do produce changes in phenotype, however • Some can affect an organism's fitness, or its ability to survive and reproduce in its environment • Other mutations may have no effect on fitness
Gene Shuffling • Mutations are not the only source of heritable variation • You do not look exactly like your biological parents, even though they provided you with all your genes • You probably look even less like any brothers or sisters you may have • Yet, no matter how you feel about your relatives, mutant genes are not primarily what makes them so different from you
Gene Shuffling • Most heritable differences are due togene shuffling that occurs during the production of gametes • Recall that each chromosome of a homologous pair moves independently during meiosis • As a result, the 23 pairs of chromosomes found in humans can produce 8.4 million different combinations of genes!
Gene Shuffling • Another process, crossing-over, also occurs during meiosis • Crossing-over further increases the number of different genotypes that can appear in offspring • Recall that a genotype is an organism's genetic makeup • When alleles are recombined during sexual reproduction, they can produce dramatically different phenotypes • Thus, sexual reproduction is a major source of variation within many populations
Gene Shuffling • Sexual reproduction can produce many different phenotypes, but it does not change the relative frequency of alleles in a population • To understand why, compare a population's gene pool to a deck of playing cards • Each card represents an allele found in the population • The exchange of genes during gene shuffling is similar to shuffling a deck of cards • Shuffling leads to different types of hands, but it can never change the relative numbers of aces, kings, or queens in the deck • The probability of drawing an ace off the top of the deck will always be 4 in 52, or one thirteenth (4/52 = 1/13) • No matter how many times you shuffle the deck, this probability will remain the same • Similarly, sexual reproduction produces many different combinations of genes, but in itself it does not alter the relative frequencies of each type of allele in a population
GENE POOL • The entire genetic content of a population is called the gene pool • Contains all the genes for all the characteristics of a population • Example: all the marbles in the barrel represent the gene pool for coat color • The fraction of marbles that represents a particular allele is called the gene frequency which may be expressed as a decimal or as a percent • The sum of all the allele frequencies for a gene within a population is equal to 1.0 or 100% • In the following illustration: 40% of the marbles are white and 60% of the marbles are brown (the frequencies can be expressed as 0.40 and 0.60 respectfully) • Dominant allele B (brown fur) (brown marble) • Recessive allele b (white fur) (white marble)
Single-Gene and Polygenic Traits • Heritable variation can be expressed in a variety of ways • The number of phenotypes produced for a given trait depends on how many genes control the trait • Among humans, a widow's peak—a downward dip in the center of the hairline—is a single-gene trait • It is controlled by a single gene that has two alleles • The allele for a widow's peak is dominant over the allele for a hairline with no peak • As a result, variation in this gene leads to only two distinct phenotypes
Single-Gene and Polygenic Traits • Single-Gene Traits: • In humans, a single gene with two alleles controls whether a person has a widow's peak or does not have a widow's peak • As a result, only two phenotypes are possible • The number of phenotypes a given trait has is determined by how many genes control the trait
Single-Gene and Polygenic Traits • As you can see, the frequency of phenotypes caused by this single gene is represented on the bar graph • This graph shows that the presence of a widow's peak may be less common in a population than the absence of a widow's peak, even though the allele for a widow's peak is the dominant form • In real populations, phenotypic ratios are determined by the frequency of alleles in the population as well as by whether the alleles are in the dominant or recessive form • Allele frequencies may not match Mendelian ratios
Single-Gene and Polygenic Traits • Many traits are controlled by two or more genes and are, therefore, calledpolygenic traits • Each gene of a polygenic trait often has two or more alleles • As a result, one polygenic trait can have many possible genotypes and phenotypes
Single-Gene and Polygenic Traits • Height in humans is one example of a polygenic trait • You can sample phenotypic variation in this trait by measuring the height of all the students in your class • You can then calculate the average height of this group • Many students will be just a little taller or shorter than average • Some of your classmates, however, will be very tall or very short • If you graph the number of individuals of each height, you may get a graph similar to the one shown below • The symmetrical bell-like shape of this curve is typical of polygenic traits • A bell-shaped curve is also called a normal distribution
Single-Gene and Polygenic Traits • Polygenic Trait: • The graph shows the distribution of phenotypes that would be expected for a trait if many genes contributed to the trait
Evolution as Genetic Change • A genetic view of evolution offers a new way to look at key evolutionary concepts • Each time an organism reproduces, it passes copies of its genes to its offspring • We can therefore view evolutionary fitness as an organism's success in passing genes to the next generation • In the same way, we can view an evolutionary adaptationas any genetically controlled physiological, anatomical, or behavioral trait that increases an individual's ability to pass along its genes
Evolution as Genetic Change • Natural selection never acts directly on genes • Why? • Because it is an entire organism—not a single gene—that either survives and reproduces or dies without reproducing • Natural selection, therefore, can only affect which individuals survive and reproduce and which do not • If an individual dies without reproducing, the individual does not contribute its alleles to the population's gene pool • If an individual produces many offspring, its alleles stay in the gene pool and may increase in frequency
Evolution as Genetic Change • Now recall that evolution is any change over time in the relative frequencies of alleles in a population • This reminds us that it is populations, not individual organisms, that can evolve over time
Natural Selection on Single-Gene Traits • Natural selection on single-gene traits can lead to changes in allele frequencies and thus to evolution • Imagine that a hypothetical population of lizards, shown in the figure at right, is normally brown, but experiences mutations that produce red and black forms • What happens to those new alleles? • If red lizards are more visible to predators, they might be less likely to survive and reproduce, and the allele for red coloring might not become common
Natural Selection on Single-Gene Traits • Natural selection on single-gene traits can lead to changes in alleles frequencies and thus to evolution • Organisms of one color, for example, may produce fewer offspring than organisms of other colors
Natural Selection on Single-Gene Traits • Black lizards, on the other hand, might absorb more sunlight and warm up faster on cold days • If high body temperature allows them to move faster to feed and to avoid predators, they might produce more offspring than brown forms • The allele for black color might then increase in relative frequency • If a color change has no effect on fitness, the allele that produces it would not be under pressure from natural selection
Natural Selection on Polygenic Traits • When traits are controlled by more than one gene, the effects of natural selection are more complex • As you learned earlier, the action of multiple alleles on traits such as height produces a range of phenotypes that often fit a bell curve • The fitness of individuals closeto one another on the curvewill not be very different • But fitness can vary a great deal from one end of such a curve to the other • And where fitness varies, natural selection can act • Natural selection can affect the distributions of phenotypes in any of three ways: • Directional selection • Stabilizing selection • Disruptive selection
Directional Selection • When individuals at one end of the curve have higher fitness than individuals in the middle or at the other end, directional selection takes place • The range of phenotypes shifts as some individuals fail to survive and reproduce while others succeed • To understand this, consider how limited resources, such as food, can affect the long-term survival of individuals and the evolution of populations
Directional Selection • Among seed-eating birds such as Darwin's finches, for example, birds with bigger, thicker beaks can feed more easily on larger, harder, thicker-shelled seeds • Suppose a food shortage causes the supply of small and medium-sized seeds to run low, leaving only larger seeds • Birds whose beaks enable them to open those larger seeds will have better access to food • Birds with the big-beak adaptation would therefore have higher fitness than small-beaked birds • The average beak size of the population would probably increase
Directional Selection • Directional Selection Directional selection occurs when individuals at one end of the curve have higher fitness than individuals in the middle or at the other end. In this example, a population of seed-eating birds experiences directional selection when a food shortage causes the supply of small seeds to run low. The dotted line shows the original distribution of beak sizes. The solid line shows how the distribution of beak sizes would change as a result of selection.
DIRECTIONAL NATURAL SELECTION • Type of Natural Selection in which individuals with one of the extreme forms of a trait have an advantage in terms of survival and reproduction
Stabilizing Selection • When individuals near the center of the curve have higher fitness than individuals at either end of the curve, stabilizing selection takes place • This situation keeps the center of the curve at its current position, but it narrows the overall graph
Stabilizing Selection • The mass of human infants at birth is under the influence of stabilizing selection • Human babies born much smaller than average are likely to be less healthy and thus less likely to survive • Babies that are much larger than average are likely to have difficulty being born • The fitness of these larger or smaller individuals is, therefore, lower than that of more average-sized individuals
Stabilizing Selection • Stabilizing selection takes place when individuals near the center of a curve have higher fitness than individuals at either end • This example shows that human babies born at an average mass are more likely to survive than babies born either much smaller or much larger than average
STABILIZING NATURAL SELECTION • Type of Natural Selection in which individuals with the average form of a trait have an advantage in terms of survival and reproduction • Extreme forms of the trait confers a disadvantage to the organism
Disruptive Selection • When individuals at the upper and lower ends of the curve have higher fitness than individualsnear the middle, disruptive selection takes place • In such situations, selection acts most strongly against individuals of an intermediate type • If the pressure of natural selection is strong enough and lasts long enough, this situation can cause the single curve to split into two • In other words, selection creates two distinct phenotypes
Disruptive Selection • For example, suppose a population of birds lives in an area where medium-sized seeds become less commonand large and small seeds become more common • Birds with unusually small or large beaks would have higher fitness • The population might split into two subgroups: • One that eats small seeds • One that eats large seeds