Download
1 / 3
30 likes | 36 Views
Resource Analysis u2013 Tracks resource<br>utilization and congestion, and monitors<br>heavily-loaded network elements<br>u2022 Network Analysis u2013 Leverages<br>utilization metrics across the network<br>to quantify the operational impact of<br>network congestion

E N D
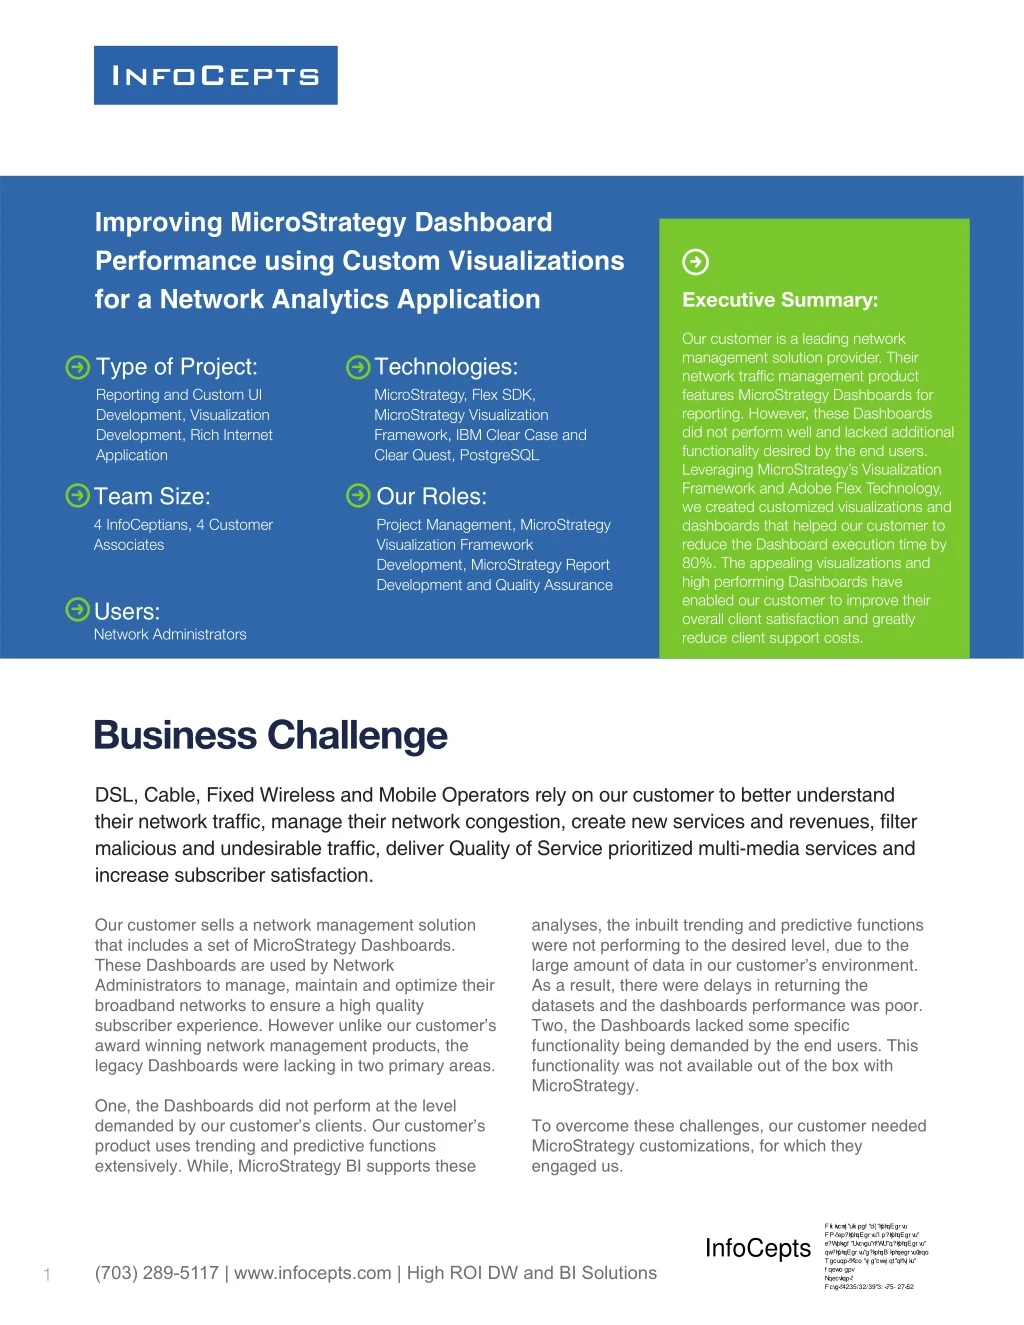
Improving MicroStrategy Dashboard Performance using Custom Visualizations for a Network Analytics Application Executive Summary: Our customer is a leading network management solution provider. Their network traffic management product features MicroStrategy Dashboards for reporting. However, these Dashboards did not perform well and lacked additional functionality desired by the end users. Leveraging MicroStrategy’s Visualization Framework and Adobe Flex Technology, we created customized visualizations and dashboards that helped our customer to reduce the Dashboard execution time by 80%. The appealing visualizations and high performing Dashboards have enabled our customer to improve their overall client satisfaction and greatly reduce client support costs. Type of Project: Reporting and Custom UI Development, Visualization Development, Rich Internet Application Technologies: MicroStrategy, Flex SDK, MicroStrategy Visualization Framework, IBM Clear Case and Clear Quest, PostgreSQL Team Size: 4 InfoCeptians, 4 Customer Associates Our Roles: Project Management, MicroStrategy Visualization Framework Development, MicroStrategy Report Development and Quality Assurance Users: Network Administrators Business Challenge DSL, Cable, Fixed Wireless and Mobile Operators rely on our customer to better understand their network traffic, manage their network congestion, create new services and revenues, filter malicious and undesirable traffic, deliver Quality of Service prioritized multi-media services and increase subscriber satisfaction. Our customer sells a network management solution that includes a set of MicroStrategy Dashboards. These Dashboards are used by Network Administrators to manage, maintain and optimize their broadband networks to ensure a high quality subscriber experience. However unlike our customer’s award winning network management products, the legacy Dashboards were lacking in two primary areas. analyses, the inbuilt trending and predictive functions were not performing to the desired level, due to the large amount of data in our customer’s environment. As a result, there were delays in returning the datasets and the dashboards performance was poor. Two, the Dashboards lacked some specific functionality being demanded by the end users. This functionality was not available out of the box with MicroStrategy. One, the Dashboards did not perform at the level demanded by our customer’s clients. Our customer’s product uses trending and predictive functions extensively. While, MicroStrategy BI supports these To overcome these challenges, our customer needed MicroStrategy customizations, for which they engaged us. ?? ? ? ? ?? ? ???? ? ??? ????? ?? ???? ? ? ??? ????? ?? ???? ? ??? ??? ?? ???? ? ?? ??? ?? ? ?? ??? ?? ???? ?? ????? ?? ???? ? ?? ???? ?? ???? ? ????? ?? ?? ? ?? ???? ? ?? ??? ??????? ?? ??? ?? ? ????? ? ????? ?? ? ? ?? ? ???? ??? ????? ? ??? ? ??? ?? ?????????????? ? ??? ??? ?? InfoCepts (703) 289-5117 | www.infocepts.com | High ROI DW and BI Solutions 1
How We Helped Our customer came to us because of our deep experience in building custom interfaces for the MicroStrategy BI Platform using MicroStrategy’s Visualization Framework. This framework, part of MicroStrategy Web SDK, enables companies to use the growing number of tools, specialized controls and charts available in the market to provide high-end visualization of MicroStrategy business intelligence data. As it is connected to the MicroStrategy architecture, it fully leverages MicroStrategy’s enterprise-class BI platform capabilities including data security, caching, prompting, history list, single sign-on, and portal integration. We worked jointly with our customer to create a set of custom visualizations and dashboards using MicroStrategy’s Visualization Framework and Abode Flex technology. Reports: We built a base set of 50 reports that enabled: • Resource Analysis – Tracks resource utilization and congestion, and monitors heavily-loaded network elements • Network Analysis – Leverages utilization metrics across the network to quantify the operational impact of network congestion • Fairshare analysis – Aids auditing of fairshare traffic management policies to understand the frequency and positive impact of client management events. This analysis empowers our customer’s clients to define policies that ensure fair access to network resources at times of congestion and to deliver a quality user experience for the maximum number of subscribers • Capacity planning – Uses network data and financial modeling to optimize capacity planning decisions Visualizations: We built 19 visualizations that were being requested by the users of this Network Analysis application. MicroStrategy’s Visualization Framework presents its own set of unique challenges. Certain visualizations, such as column charts and tree diagrams are not available out of the box and require custom programming. The custom visualizations, developed using this framework and Flex technology, are re-usable components and include the following: • Column graph and Line graph Widgets: Various visualizations using Flex controls involving combination of single column/line graphs and stacked columns/lines and including features like custom data tip, setting custom titles, rotating axis labels, and scrollable axis • DataGrid Widgets: Various DataGrid visualizations including features like multiple selection of rows in a DataGrid, sorting, search functionality, drill-downs and embedding other controls like button, image, label, etc. in the grid rows High Performing Dashboards: One of the major challenges that we helped our customer overcome was the slow performance of their existing dashboards. Our approach, outlined below, reduced the time it takes to render Dashboards to less than five seconds: • In legacy Dashboards, calculations for forecasting were executed on the MicroStrategy server. We broke down the statistical formulas and performed the • Tree Widgets: Geography tree and Topology tree visualizations with multi-level hierarchy and search functionality (703) 289-5117 | www.infocepts.com | High ROI DW and BI Solutions 2
calculations at client side (in browser). This required us to develop custom Adobe Flex controls which perform calculations at run time. The result of this was the population of the complete visualization on the UI in less than a second, which has been one of the highlights of the project answers to the Intelligence Server, thereby improving the performance. “What-if” Analysis - Migration from Excel to Adobe Flex: In the legacy form of this functionality, Excel was used for what-if analysis. Excel spreadsheets had hundreds of formulae which were challenging to maintain. In addition the Excel spreadsheets were not very responsive and interactive. We worked through the formulae and converted these to Flex/ Action Code versions. These are now rendered in Flex charts and components. All calculations are done on the Client side to greatly improve performance. End-user selections are saved on the Client’s machine as cookies enabling the user to view the most recent analysis, when a Dashboard is opened. • We successfully deployed incremental and dynamic data fetching using MicroStrategy’s Task API. For a typical MicroStrategy Dashboard, the entire data set is returned to the Dashboard based on the prompt answers provided at report/document load. In our customer’s case, these data sets were very large. The data is then filtered as needed from within the Dashboard and the initial retrieved data set. In our implementation, we retrieved data from the database as required, during run time, by sending prompt High ROI BI Delivered As a result of our effort, we delivered high performing and visually advanced Dashboards for our customer’s product that provided the following benefits: got unique visibility into their network’s resource utilization. The customized dashboards provided user friendly visualization and helped in predicting trends for key metrics. With these features, our customer was able to earn new clients, increase their overall client satisfaction, reduce churn and support costs The end users of Internet Service Providers (ISPs) MicroStrategy server to client server reduced the time required for complex statistical calculations from a minute to less than a second. This has empowered the end users to make critical, real time decisions Migration of forecasting calculations from differentiated policies to decide on the actions to be taken on account of network congestion, and the conditions to trigger the actions based on users, application, etc. These reports are important to meet customer and regulatory expectations for fair use Fairshare analysis helped ISPs to create fair and seconds to less than five seconds for all reports and visualizations, a key requirement of our customer Dashboard execution time was reduced from thirty About InfoCepts Since 2004, InfoCepts has delivered on the promise of Business Intelligence. Our consulting capabilities and process oriented approach, with world class governance frameworks have delivered high quality solutions to our customers. Our technology specific methodologies and global delivery model provides exceptional ROI for our customers. Our services include high quality Mobile Apps, award winning Dashboards and end-to-end business intelligence development and support using a host of technologies. 1750 Tysons Blvd, Suite 1500, McLean, VA 22102, USA (703) 289 -5117 | sales@infocepts.com 3