Download
1 / 23
250 likes | 514 Views
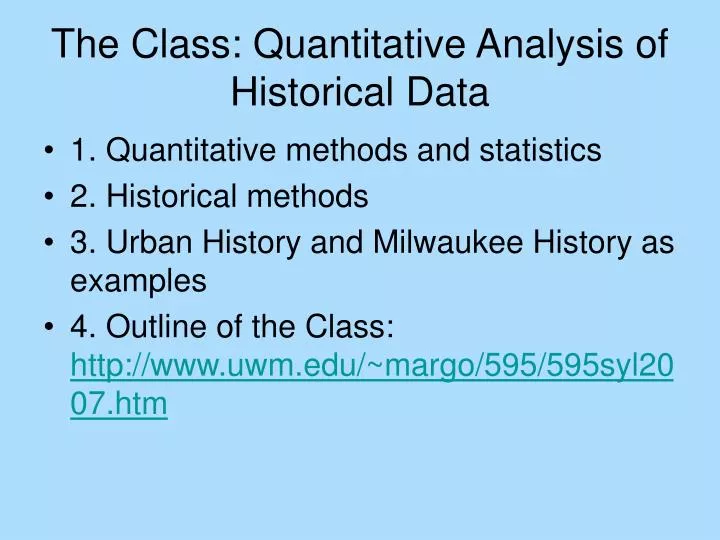
The Class: Quantitative Analysis of Historical Data. 1. Quantitative methods and statistics 2. Historical methods 3. Urban History and Milwaukee History as examples 4. Outline of the Class: http://www.uwm.edu/~margo/595/595syl2007.htm. Uses of Quantitative History.

E N D
The Class: Quantitative Analysis of Historical Data • 1. Quantitative methods and statistics • 2. Historical methods • 3. Urban History and Milwaukee History as examples • 4. Outline of the Class: http://www.uwm.edu/~margo/595/595syl2007.htm
Uses of Quantitative History • Allows the study of the history of ordinary people who don’t leave archival records, aren’t famous or powerful • Thus history using averages and patterning rather than study of individual events. • We will ask how people lived: • 1. What kinds of jobs did they have? • 2. What were their houses and neighborhoods like? • 3. What was the ethnic composition of the city?
Uses of Quantitative History, cont. • We can also study trends – in population, in economic change, social attitudes, political activities….. • We can draw graphs and create visual displays of information….
Timeline • 1456: Gutenberg Bible (Invention of movable type) • 1492 Columbus’ “Discovery” of the New World • ca 1500 Renaissance • 1517 Protestant Reformation • 1607: Founding of Virginia (Jamestown Colony) • 1620-30: Founding of Plymouth Colony and Massachusetts Bay
Timeline • 1456: Gutenberg Bible (Invention of movable type) • 1492 Columbus’ “Discovery” of the New World • ca 1500 Renaissance • 1517 Protestant Reformation • 1607: Founding of Virginia (Jamestown Colony) • 1620-30: Founding of Plymouth Colony and Massachusetts Bay
Terms for Today, 1 • Matrix, Database: A Table of Data • Codebook: A Guide to the Matrix or Database • Case: Unit of analysis (Row) • Variable: Information collected on each unit (Column) • Value, Code: Cell
A Database or Matrix Case YRBUILT PERSON AGE OCC$ NATIV$ • 1 988 2 39 profcl amer • 2 893 6 39 skille amer • 3 892 6 47 skille germ • 4 . 5 45 skillp germ • 5 . 1 72 unskil germ • 6 . 4 31 skillp amer • 7 . 6 48 skillp germ • 8 . 3 34 unskil amer • 9 . 3 62 germ • 10 889 6 46 skille germ
A Database or Matrix Case YRBUILT PERSON AGE OCC$ NATIV$ • 1 988 2 39 profcl amer • 2 893 6 39 skille amer • 3 892 6 47 skille germ • 4 . 5 45 skillp germ • 5 . 1 72 unskil germ • 6 . 4 31 skillp amer • 7 . 6 48 skillp germ • 8 . 3 34 unskil amer • 9 . 3 62 germ • 10 889 6 46 skille germ
A Database or Matrix Case YRBUILT PERSON AGE OCC$ NATIV$ • 1 988 2 39 profcl amer • 2 893 6 39 skille amer • 3 892 6 47 skille germ • 4 . 5 45 skillp germ • 5 . 1 72 unskil germ • 6 . 4 31 skillp amer • 7 . 6 48 skillp germ • 8 . 3 34 unskil amer • 9 . 3 62 germ • 10 889 6 46 skille germ
A Database or Matrix Case YRBUILT PERSON AGE OCC$ NATIV$ • 1 988 2 39 profcl amer • 2 893 6 39 skille amer • 3 892 6 47 skille germ • 4 . 5 45 skillp germ • 5 . 1 72 unskil germ • 6 . 4 31 skillp amer • 7 . 6 48 skillp germ • 8 . 3 34 unskil amer • 9 . 3 62 germ • 10 889 6 46 skille germ
A Database or Matrix Case YRBUILT PERSON AGE OCC$ NATIV$ • 1 988 2 39 profcl amer • 2 893 6 39 skille amer • 3 892 6 47 skille germ • 4 . 5 45 skillp germ • 5 . 1 72 unskil germ • 6 . 4 31 skillp amer • 7 . 6 48 skillp germ • 8 . 3 34 unskil amer • 9 . 3 62 germ • 10 889 6 46 skille germ
Terms for Today, 1 • Matrix, Database: A Table of Data • Codebook: A Guide to the Matrix or Database • Case: Unit of analysis (Row) • Variable: Information collected on each unit (Column) • Value, Code: Cell • Case YRBUILT PERSON AGE OCC$ NATIV • 1 988 2 39 profcl amer • 2 893 6 39 skille amer • 3 892 6 47 skille germ • 4 . 5 45 skillp germ • 5 . 1 72 unskil germ • 6 . 4 31 skillp amer • 7 . 6 48 skillp germ • 8 . 3 34 unskil amer • 9 . 3 62 germ • 10 889 6 46 skille germ
Terms, 2: Types of Data • Microlevel: data collected on the characteristics of individual cases, people, houses, events, that is, discrete units. For example an individual, with characteristic information on sex, age, state of residence, etc. • Aggregate: Tabular data representing counts of units falling into particular categories, e.g., populations of states. The state is the unit of analysis; the variables are the name of the state and the population of the state.
A Database or Matrix: Microlevel Case YRBUILT PERSON AGE OCC$ NATIV$ • 1 988 2 39 profcl amer • 2 893 6 39 skille amer • 3 892 6 47 skille germ • 4 . 5 45 skillp germ • 5 . 1 72 unskil germ • 6 . 4 31 skillp amer • 7 . 6 48 skillp germ • 8 . 3 34 unskil amer • 9 . 3 62 germ • 10 889 6 46 skille germ
Terms 3: Sources of Data • Survey: collected specifically for the research purpose, e.g., Current Population Survey, General Social Survey, census. • Administrative record: records of immigrant arrivals by port; tax filings; vital registration records; case files of judicial proceedings, health records.
Terms 4: Characterizing Datasets • Population or Sample • Population: all possible units in the universe • Sample: a selection of possible units • Probability or Random Sample: sample selected using probability methods • Parameters and Statistics • Parameters: characteristics of populations • Statistics: characteristics of samples • Cross Section or Time Series • Cross Section: Set of measurements at one point in time • Time Series: Set of measurements on the same phenomenon at different points in time.
Levels of Measurement or Types of Variables • Nominal: categories are exclusive but bear no other relationship to each other. Ex: (1) Jews; (2) Protestants; (3) Catholics; (4) Muslims. 2P does not equal M. • Ordinal: Ordinal: categories are continuous and in ascending sequence but distance between two categories is not equal. Ex: ordinal scales of wealth. wealthiest, second wealthiest . . .n wealthiest. The wealthiest does not necessarily have 3 times the wealth of the 3rd wealthiest. • Interval: True numbers are potentially continuous and in ascending sequence and the distance between any two units of value is equal. Ex: family size. 1,2,3,4, etc.; income.1000,2000,3000. • Ratio: interval variable with a zero point.