Download
1 / 35
350 likes | 586 Views
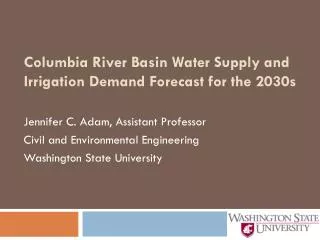
Columbia River Basin Water Supply and Demand Forecast for 2030. Presented by: Keyvan Malek, Washington State University Contributors: J.C. Adam, K. Chinnayakanahalli , K. Rajagopalan, R. Nelson, M.E. Barber, C. Stockle, M. Brady, G. Yorgey, S. Dinesh, C. Kruger Washington State University

E N D
Columbia River Basin Water Supply and Demand Forecast for 2030 Presented by: Keyvan Malek, Washington State University Contributors: J.C. Adam, K. Chinnayakanahalli, K. Rajagopalan, R. Nelson, M.E. Barber, C. Stockle, M. Brady, G. Yorgey, S. Dinesh, C. Kruger Washington State University Presented at: 2nd annual PNW Climate Science Conference, Seattle Sep, 2011
WSU Modeling Team Dr. Jennifer Adam Assistant Professor, Civil and Environmental Engineering Dr. Claudio Stöckle Professor and Chair, Biological Systems Engineering Dr. Michael Brady Assistant Professor, School of Economic Sciences Dr. Michael Barber Professor and Director, Washington Water Research Center Dr. KiranChinnayakanahalli Post-Doctoral Associate, Washington Water Research Center Chad Kruger Director of Center for Sustaining Agriculture & Natural Resources (CSANR) Roger Nelson Research Associate and Programmer, Biological Systems Engineering KirtiRajagopalan PhD Student, Civil and Environmental Engineering ShifaDinesh PhD Student, Civil and Environmental Engineering Georgine Yorgey Associate in Research, Center for Sustaining Agriculture & Natural Resources (CSANR)
Outline of Talk • Goals • Background • Modeling Approach • Results • Conclusions
Goals • To project 2030s water supply and demand in the Columbia River Basin • Agricultural and Municipal demands considered • To study the effect of climate change on agriculture (crop water demand, crop yield, cropping pattern)
Background • Columbia River • Water resources sensitive to climate change • Economic value of agriculture (5 billion $ in WA) • Irrigation largest out-of-stream water user • Diverse crop mix
Models Used VIC Hydrology Liang et al, 1994 CropSyst Cropping Systems Stockle and Nelson 1994
VIC-CropSyst Model VIC CropSyst 1. Weather (D) 2. Soil Soil layer depths Soil water content 3. Water flux (D) Infiltrated water 4. Crop type Irrigation water = Crop Water Demand /irrigation efficiency Sow date Crop interception capacity Crop phenology Crop uptake (D) Water stress (D) Current biomass (D) Crop Water demand (D) Harvest day Crop Yield D – communicated daily
VIC-CropSystCoupling Approach T T – Transpiration IP – Interception capacity I – Infiltration Ir – irrigation Wd- Water demand Q – Runoff Q01 – Drainage from 0 to 1 Q02 – Drainage from 0 to 2 Qb– Baseflow W0 – water content in 0 W1 – water content in 1 W2 - water content in 2 Tmin, Tmax – daily minimum and maximum temperature Ws – wind speed RH – Relative humidity SR – Solar radiation IP Ir I Q T0, T1, T2, IP, Wd Q01 Daily Tmin, Tmax, Ws, RH, SR, I Q12 Redistribute I, W0, W1 and W2 to CropSyst layers W0,W1, W2 Qb CropSyst VIC
Invoking CropSyst within VIC gridcell CropSyst is invoked Crop 2 CropSyst is invoked Crop 1 Non-Crop Vegetation VIC grid cell (resolution=1/16°) (~ 33 km2)
Crops Modeled • Winter Wheat • Spring Wheat • Alfalfa • Barley • Potato • Corn • Corn, Sweet • Pasture • Apple • Cherry • Lentil • Mint • Hops Major Crops • Grape, Juice • Grape, Wine • Pea, Green • Pea, Dry • Sugarbeet • Canola • Onions • Asparagus • Carrots • Squash • Garlic • Spinach Berries • Grape, Juice • Grass hay • Bluegrass • Hay • Rye grass • Oats • Bean, green • Rye • Barley • Bean, dry • Bean, green Other Pastures • Caneberry • Blueberry • Cranberry • Pear • Peaches Other Tree fruits Lentil/Wheat type Generic Vegetables
The Reservoir Model (ColSim) (Hamlet et al., 1999) Reservoir Operating Policies Physical System of Dams and Reservoirs Reservoir Storage Regulated Streamflow Flood Control Energy Production Irrigation Consumption Streamflow Augmentation VIC Streamflow Time Series Slide courtesy of Alan Hamlet
ColSim Reservoir Model (Hamlet et al., 1999) for Columbia Mainstem Model used as is, except for • Withdrawals being based on VIC-CropSyst results • Curtailment decision is made part of the reservoir model Green triangles show the dam locations
Curtailment Rules (Washington State) Curtailment based on instream flow targets • Columbia Mainstem • Lower Snake • Central Region (Methow, Okanogan, Wenatchee) • Eastern Region (Walla Walla, Little Spokane, Colville) Prorated based on a calculation of Total Water Supply Available • Yakima
Integration with Economics Inputs Modeling Steps Outputs Biophysical Modeling: VIC-CropSyst, Reservoirs, Curtailment Future Climate Scenario Water Supply Irrigation Water Demand Unmet Irrigation Water Demand Effects on Crop Yield • Adjusted Crop Acreage • Selective Deficit Irrigation Water Management Scenario • Crop Yield (as impacted by climate and water availability) Economic Scenario Economic Modeling: Agricultural Producer Response
Model Scenarios: Low, Middle, High • Climate Change Scenarios • HADCM_B1, CCSM_B1, CGCM_B1, PCM_A1B, IPSL_A1B • Hybrid Delta Downscaling Approach (2030s climate) • GCMs and Emission Scenarios chosen for low/middle/high precipitation and temperature change combinations • Water Management Scenarios • Additional Storage Capacity • Cost Recovery for Newly Developed Water Supply • Economic Scenarios • International Trade • Economic Growth
The UW CIG Supply Forecast http://www.hydro.washington.edu/2860/ Slide courtesy of Alan Hamlet
Application of the UW CIG Water Supply Forecast • WSU is building directly off of the UW water supply forecasting effort (Elsner et al. 2010) by starting with these tools that were developed by UW Climate Impacts Group: • Implementation of the VIC hydrology model over the Pacific Northwest at 1/16th degree resolution • Reservoir Model, ColSim • Historical climate data at 1/16th degree resolution • Downscaled future climate data at 1/16th degree resolution • By explicitly incorporating irrigation water demand into this framework, we can explore the coupled dynamics between water supply and water demand
Results • Supply Forecast • Irrigation Demand Forecast
Supply in 2030s for the Columbia River Basin (at Bonneville- the outlet of Columbia river basin) • Annual flows are projected to increase by 3% • Summer flows are projected to decrease by 16% Note: The above numbers are based on an average of all 5 future climate scenarios considered
Water Supply Entering Washington • Eastern: increasing • Western: decreasing Top: 2030 Flow (cfs) Bottom: Historical Flow (cfs)
Snake River and Columbia River Supplies (Entering Wasington) Snake river Columbia river
Irrigation and Municipal Demands by Watershed in Washington State
Yakima Supply and Demand Historical Future: Hadcm_B1
Historical Walla WallaSupply and Demand Future: Hadcm_B1
Impacts on Irrigation Demand • Projected demand for 2030s (middle climate change and economic scenarios): Columbia River Basin Scale Average annual “top of the crop” irrigation demand increases from 10.7 MAF to 11.8 MAF (increase of 10%) Washington State Average annual “top of the crop” irrigation demand increases from 4.9 MAF to 5.5 MAF (increase of 12%)
Dam-Regulated Supply versus Demand for Columbia River Basin (at Bonneville) 2030 results are for - HADCM_B1 climate scenario - average economic growth and trade Note: Supply is reported prior to accounting for demands
Conclusions • Supply: we see a small increase (3%) in annual supply in the 2030s • But, summer supplies (when there is irrigation demand) decreases about 16% • Demand: we see a significant increase in annual irrigation demand (10% for the entire Columbia River Basin) in the 2030s • Increased irrigation demand, coupled with decreased seasonal supply poses difficult water resources management questions, especially in the context of competing in stream and out of stream users of water supply.
Acknowledgements • Many thanks to members of the University of Washington Climate Impacts and Land Surface Hydrology Groups • Alan Hamlet • Marketa Elsner • Pablo Carrasco • Se-Yeun Lee • Dennis Lettenmaier • Funding was provided by the Washington State Department of Ecology
Uncertainties 1-Future climate (due to GCMs, greenhouse emission scenarios anddownscaling approach) 2-Model structure (VIC-CropSyst) 3-Water management and economic scenarios 4-Cropping pattern - discrepancy between multiple data sources 5-Irrigation supply – poor data on groundwater and surface waterproportions of the supply 6-Irrigation methods a)No information for upstream states b)Conveyance loss is not explicitly modeled (This is a proportion of the demand at each WRIA)
Change in Crop Yield • Change in some crop yield • Trees does not show significant change • Results are for full irrigation
Crop Mix Information for the Columbia River Basin • United States Department of Agriculture (USDA) • Washington State Department of Agriculture (WSDA)
Yakima Reservoir Model Instream flow targets Total System of Reservoirs (capacity 1MAF approx.) Monthly Inflows from VIC-CropSyst Gauge at Parker Irrigation demand from VIC/CropSyst Curtailment rules Proratable water rights prorated according to Total Water Supply Available (TWSA) calculated each month • Objectives: • Reservoir refill by June 1st • Flood space availability