Download
1 / 49
490 likes | 581 Views
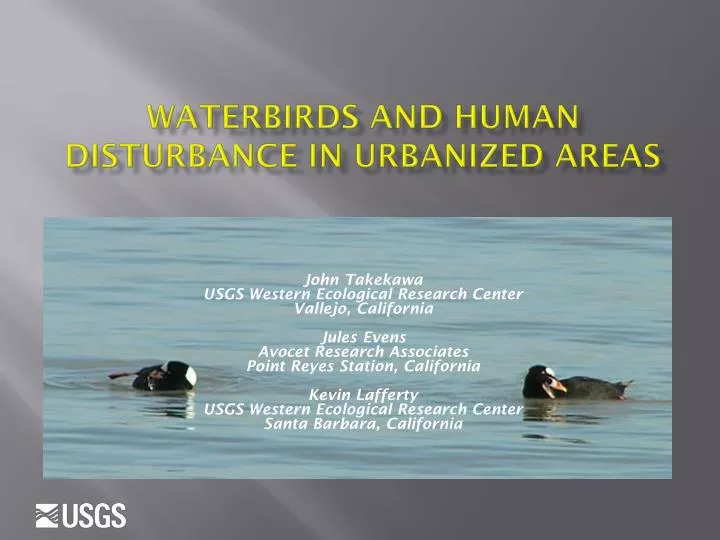
Waterbirds and Human Disturbance IN URBANized Areas. John Takekawa USGS Western Ecological Research Center Vallejo, California Jules Evens Avocet Research Associates Point Reyes Station, California Kevin Lafferty USGS Western Ecological Research Center Santa Barbara, California.

E N D
Waterbirds and Human Disturbance IN URBANized Areas John Takekawa USGS Western Ecological Research Center Vallejo, California Jules Evens Avocet Research Associates Point Reyes Station, California Kevin Lafferty USGS Western Ecological Research Center Santa Barbara, California
Activity 1. Causes of Impact Harvest Habitat Modification Pollution Disturbance 2. Immediate Response Behavior Change Death 3. Long-term Effects on: Altered Behavior Altered Vigor Altered Productivity Death a. Individuals Abundance Distribution Demographics b. Populations Species Composition Interactions c. Communities Wildlife Response to Recreational Activities (Knight and Cole, 1995)
Generalizations about disturbance of waterbirds • Size correlation: larger birds are less tolerant of human disturbance than smaller ones (Rodgers and Schwikert 2003, Fernandez-Juricicet al. 2002) • Larger flocks flush at greater distances than smaller flocks or individuals. • Flight distance correlated positively with flock size and species diversity. Flight distances longer for species that used open water for foraging than for resting (Mori et al. 2003, ARA 2008) • To compensate for increased disturbance, birds may increase food intake or relocate to less profitable areas to feed.
Factorsaffecting response • Size of area available: the larger the habitat patch, the shorter the distance of flight response, the lower the disturbance. • Proximity of refuge. • The “shyness” of the species (Scaup versus Ring-billed Gull) • Size of the species (a black rail allows closer approach than a heron) • Season: periods of high-energy costs exact more “expensive” responses. • Flight distances are longer for waterfowl that used an area for foraging than for resting (Mori et al. 2001)
Waterbirds susceptible to disturbance by watercraft • Solitary nesting birds • Colonial nesting birds • Flocking shorebirds • Rafting waterbirds
Colonial nesting waterbirds • More sensitive than roosting and foraging birds • Response depends on site, colony size, species and time of year. • Recommended buffer zones around colonies range from 100 m (Rodgers and Smith 1995), to 300 m (Butler 1992), recommended by JE (Jan-Sep).
Flocking shorebirds • Tidal flat specialists • Peak numbers occur during migratory pulses in fall and winter, but large numbers of overwinter; a few species nest. • Foraging shorebirds somewhat protected from watercraft on tidal flats or in very shallow (<10 cm) water. However, high tide roosts are susceptible to disturbance (Burger and Gochfield 1991, Davidson 1993, Kelly 1997).
Rafting waterfowl: divers and dabblers • Majority occur in SFB during “winter” (Oct-Apr). • Divers on open water, dabblers on seasonal wetlands. • Divers gather in large flocks (rafts) concentrated at the mouths of tributaries, bays and coves. • Scaup and scoters combined comprised 87 percent of waterfowl on open water. • Large flocks of scaup, scoter and others key on herring spawn in eelgrass beds (Zostera marina)
Waterfowl abundance on SFB • Mid-winter aerial surveys from 1970-1991 averaged 425,000 waterfowl present in mid-Feb. • Mid-winter waterfowl surveys 1992-2007 (exclusive of 1996) averaged 182,818 birds present in mid-Jan. • Numbers of waterfowl decreased 25% from the 1950s until 1990 (Takekawa et al. 2000). • Waterfowl continue their downward trend from 300,000 in the late 1980s (Accurso 1992) to 184,160 (SE±65,670) from 1992-2007.
Analysis of disturbance trials • N =74 • Earliest (most distant) response: • 52% swimming • 31% diving • 16% flight • ANOVA to examine differences in species disturbance responses between number of kayaks (1 vs. 2 or 3), tide level, year, weekday s weekend, and transect area (depth) • No significant differences were found in species responses related to the main effects of year, tide level, transect area, weekday vs. weekend, or number of kayaks (P > 0.05)
Buffer Zones • Species buffer zones based on observed flush distances (mean plus one SD, after Rodgers and Schwikert 2003) • Add 40 m to buffer to minimize agnostic responses and to account for mixed species (Thompson and Thompson 1985, Gutzwiller et al. 1998). • Buffer zones should be based on the species most sensitive to disturbance (scaup) • “One size fits all” approach for management: “therefore a buffer zone of 250 meters from areas of high-use by rafting waterbirds as a quideline for minimizing the impacts of non-motorized watercraft on rafting waterbirds.”
Resource Concerns: Open Water Disturbance Displacement Effects Habitat Erosion SFB FERRIES
Objectives 1. Conduct ferry surveys in San Francisco Bay to assess species-specific buffer distances. 2. Examine waterbird avoidance of watercraft in land-based surveys at selected areas. 3. Document distribution of waterbirds along ferry routes with aerial surveys.
Disturbance Zone – Behavior Effect Flight Response Distance? Distance? Diving Response
Photo Ann Cook Disturbance Zone – Behavior Effect
Disturbance Zone – Population Effect Distance? Distance?
Duration of Disturbance Elapsed Time?
Duration of DisturbanceParadise Beach Time since last ferry, minutes
Coal Oil Point Reserve University of California Natural Reserve System -Up to 150 wintering snowy plovers -No successful breeding for 30 years -Uncontrolled public access -No previous plover management
Initiate applied research • Why study disturbance? • Project goals • Sources of disturbance • Rates of disturbance • Management model • Lafferty, K. D. 2001. Birds at a Southern California beach: seasonality, habitat use and disturbance by human activity. Biodiversity and Conservation 10:1949-1962. • Lafferty, K. D. 2001. Disturbance to wintering western snowy plovers. Biological Conservation 101:315-325. • Lafferty, K. D., D. Goodman, and C. P. Sandoval. 2006. Restoration of breeding by snowy plovers following protection from disturbance. Biodiversity and Conservation 15:2217-2230.
Document plover population Winter roost
Determine human use • What do they do? • 85% walk • 68% jog • 46% sunbathe • 38% surf • 21% watch sunset • 20% party • 15% beach cleanup • 14% dog walk • 13% bird watch • 12% painting • 12% ride horses • Who uses the beach? • 72% are students • 7 visits / mo. for 2 yrs • Lack of Awareness • 98% could not identify a snowy plover • 67% did not know the area was a reserve
Measure disturbance rates • How much disturbance does each plover experience? • Weekday: every 43 min. • Weekend: every 27 min. • 16 times higher than at protected beaches
Undertake management actions • Close delta trail • Rope roost area • Place signs • Initiate a docent program
Education • Compliance (leash law, trespass) • Scare crows from nests Initiate docent program
Questions • How do we measure non-lethal costs of disturbance and weigh those at the population level? • The effects of disturbance may be primarily behavioral rather than numerical; do multiple regression studies designed to examine the effects of independent variables measure disturbance effectively? • Site specific habitat elements may override expected responses by waterbirds: How do we identify which sites are peculiar and which are normal. • How does habituation factor in and what are the costs to reproductive fitness? • What would be the habitat values if background disturbance didn’t eliminate larger and more sensitive species?