Download
1 / 38
380 likes | 503 Views
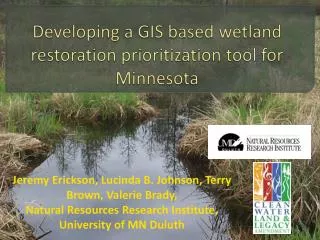
Developing an Index of Stream – Wetland – Riparian Condition. Brooks et al. 2009. How do our estimates of condition compare across levels of measurement resolution and across geographic scales?. LEVEL 1 (LANDSCAPE FROM GIS). LEVEL 2 (RAPID FIELD ASSESSMENT).

E N D
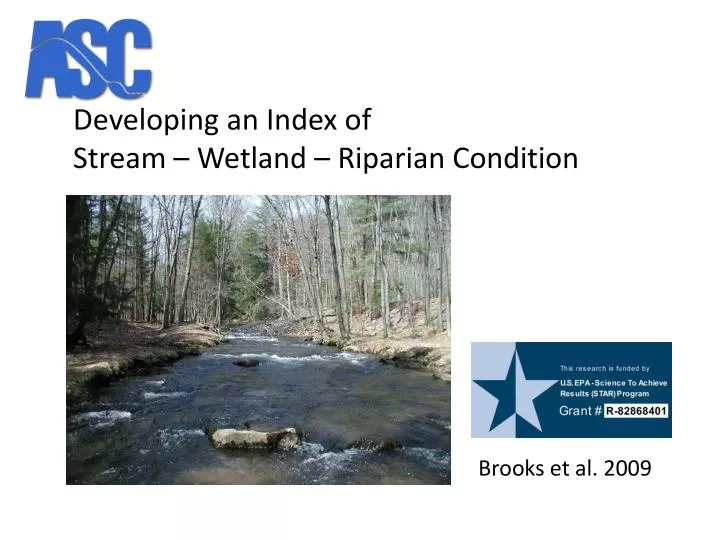
Developing an Index of Stream – Wetland – Riparian Condition Brooks et al. 2009
How do our estimates of condition compare across levels of measurement resolution and across geographic scales? LEVEL 1 (LANDSCAPE FROM GIS) LEVEL 2(RAPID FIELD ASSESSMENT) LEVEL 3 (INTENSIVE FIELD ASSESSMENT)
Stream-Wetland-Riparian (SWR) Index Floodplain-Wetland Condition Conceptual Model of Condition Used for SWR Index Incision Ratio # Stream Stressors SHA Score Buff0-300 Basal Area Invasives # FP-WL Stressors
Stream Habitat Assessment (SHA) variables: • (each gets 1-10 BPJ rating) • Epifaunalsubstrate • Embeddedness • Velocity/Depth regime • Sediment deposition • Channel flow • Channel alteration • Frequency of riffles • Bank stability • Vegetative protection • Riparian vegetative zone width
STRESSORS - Brooks et al. SWR – site and buffer (<30 m, 30-100 m) Hydrologic modification (+ or -, ditch, fill, dead trees, stormwater, roads) Sedimentation/Erosion (deposits, intensive grazing, active construc) Dissolved oxygen (excessive density of algal mats, excessive deposition of organic waster, discharges of organic wastewater) Contaminant toxicity (ptdischarges, severe veg stress, chemodors) Vegetation alteration (mowing, moderate grazing, brush cutting) Eutrophication (discharges, heavy algal mats, direct discharges from septic or wastewater treatment systems) Acidification(atmosph. deposition, AMD, adjacent mine spoil piles) Turbidity (mod. Concentration suspended solids in water column, obvious sediment plumes) Thermal alteration (significant increases in water temperature, recent human-induced canopy removal) Salinity(obvious increase in dissolved salts) Habitat fragmentation - handled w/ Landscape Index
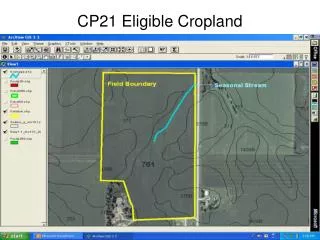
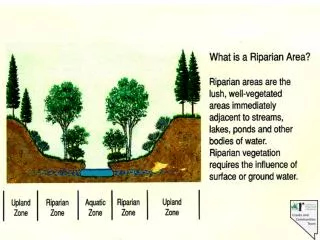
LEVEL 1 (LANDSCAPE FROM GIS) • overall watershed • contributing area to sample point • 1-km circle centered on sample point • LEVEL 2 (RAPID FIELD ASSESSMENT) • SWR – single site • SWR – average for watershed or contributing area • LEVEL 3 (INTENSIVE FIELD ASSESSMENT) – existing data • benthic IBI, fish IBI, NO3
LANDSCAPE METRICS (FROM GIS) • Percent Forest • Land Development Intensity coefficient (LDI) • Impervious Surface • Mean Forest Patch Size • [Core Forest/ Total Forest] LANDSCAPE SCORES • LANDSCAPE INDEX = • AVERAGE [ % forest score + • (LDI score + Impervious Surface score)/ 2 + • (Forest Patch Size score + Core Forest score) /2 ]
LEVEL 1 – LANDSCAPE INDEX 2. contributing area to IBI sample point 3. 1-km circle centered on SWR sample point 1. overall watershed
Avg. SWR Index in MBSS point contributing area vs. IBI score Correlation between SWR Index and MBSS (n=60):
Ref. Std >75% forest Moderate 40-75% Ref. std 30-50% forest Low 25- 40% Forest Agriculture Scale comparing condition Social choice D Ref. Std. 40-75% tree cover Urban Scale comparing social choices Social choice D
Watersheds with best agreement between Level 1 (landscape) vs. Level 2 (site level):
Watersheds where Level 2 (site level) score >> Level 1 (landscape) score
Yetter, IBI slope & stream points
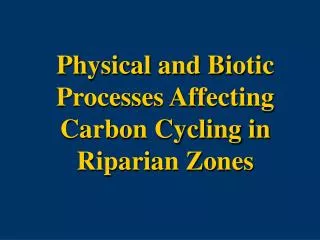
Selected Ecosystem Services – to Final Services (HOUSEHOLD OR INDIVIDUAL FARM/BUSINESS FOCUS; ON-SITE VS. OFF-SITE BENEFITS&COSTS) 1 - WATER PURIFICATION (HAVING CLEANER WATER; IMPROVED WATER QUALITY; RETAIN, REMOVE, TRANSFORM NUTRIENTS - (preventing excess nutrients entering stream – links to healthy stream for fishing, livestock drinking water, avoid or eliminate regulatory “impaired” water determination) 2- WATER-BASED RECREATION (FISHING, MAYBE SMALL BOATING) (need to parse among coldwater, coolwater, and warmwater fisheries) 3- ECOLOGICAL HEALTH (NON-USE VALUES FOR ENTIRE SYSTEM OF STREAM-WETLAND-RIPARIAN BIODIVERSITY) 4- FLOOD STORAGE & DESYNCHRONIZATION (reduced damage to property and crops; need to tie to measurement of flood risk, then $), whereas riparian buffers filter upland sources of nutrients moving toward waterbodies, properly connected flooding regime allows transformation of nutrients by the floodplain and wetlands when stream overflows (therefore, less incised due to land use proportions) 5 – CARBON SEQUESTRATION (ESTIMATES BASED ON LAND USE CONVERSION (e.g., crop to forest) or VEGETATION/SOIL BASED CARBON PER UNIT AREA)
Valuation of Ecosystem Services to Final Services
Ecosystem Services to be Valued • Criteria • Potentially large value • Know linkages between intervention and service • Have estimates of economic value • Initial List • Values tied to direct use • Fishing/Boating/Swimming • Nonuse Values and indirect use values • Existence value for Habitat/Ecosystem Health • Carbon Sequestration • Pockeboot Impacts • Water Purification Costs • Property damage from floods
Recreational Use • Model of recreational fishing behavior • Can calculate benefit to anglers of spatially explicit changes in fishing quality • One quality measure used: National Fish Habitat Partnership Habitat Degradation Risk Index • Based largely on landscape upstream • Can value a change in HDRI • Need to know linkage between intervention and HDRI • Much less info available on swimming and boating, but we are looking
Nonuse Values • Measure using general population surveys to measure WTP for improvements in stream/river quality • Water Quality • Biological Health • Need to know linkages between intervention and water quality and/or biological health
Water Quality Scales • National Sanitation Foundation WQI • 9 water quality measures, including nitrates, total phosphate and turbidity • qi = quantile of that measure • wi = weight for that measure • WQI ranges from 0 to 100 • Can be calculated based on subset of WQ measures
Water Quality Scales • Water Quality Ladders • Drinkable 95 • Swimmable 70 • Fishable 50 • Boatable 25 • Suitable for outings 15 • Not suitable for any use 5 • Measure WTP to move up ladder • Scale comparable to WQI?
Biological Health • Biotic Indices/scales developed by team 3 • WTP for changes in biological health – MidAtlantic Slope Consortium survey • Need to be able to link the two
Carbon Sequestration • Intervention may affect carbon sequestration • Forested buffer vs cropland • No-til vs conventional • Fed Govt has standard dollar values for social cost of carbon • Need to know carbon seq effect of intervention
Others • Water Purification • Impact of intervention on criteria water pollutants downstream • Population using surface water supplies downstream of intervention • Average impact on treatment cost • Property damage from floods • Change in downstream flood frequency • Downstream properties at risk