Download
1 / 11
110 likes | 257 Views
Planner Aug 29 T: Data Analysis D : Analyze graphs and write about data. DO NOW page 26 - Correct the following. Table of Contents 8/12 Claims and Evidence 2-3 8/13 Lab Safety 4-5 8/14 Questions 6-7 8/15 What is Science 8-9

E N D
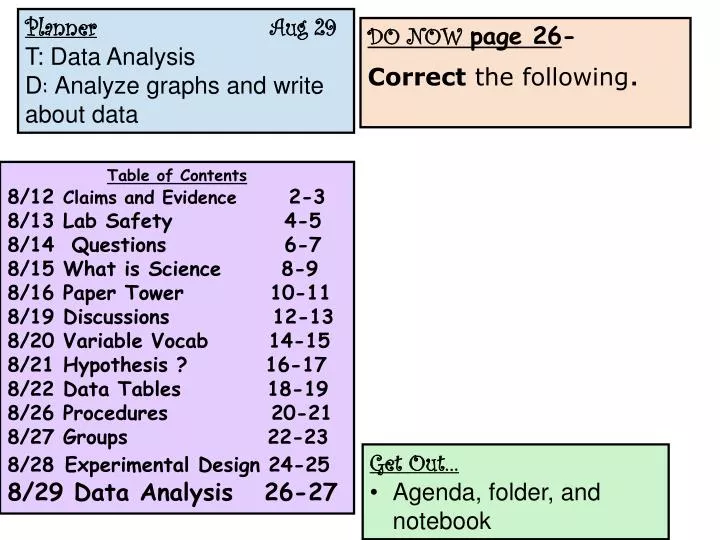
Planner Aug 29 T: Data Analysis D: Analyze graphs and write about data DO NOW page 26- Correct the following. Table of Contents 8/12 Claims and Evidence 2-3 8/13 Lab Safety 4-5 8/14 Questions 6-7 8/15 What is Science 8-9 8/16 Paper Tower 10-11 8/19 Discussions 12-13 8/20 Variable Vocab 14-15 8/21 Hypothesis ? 16-17 8/22 Data Tables 18-19 8/26 Procedures 20-21 8/27 Groups 22-23 8/28Experimental Design 24-25 8/29 Data Analysis 26-27 • Get Out… • Agenda, folder, and notebook
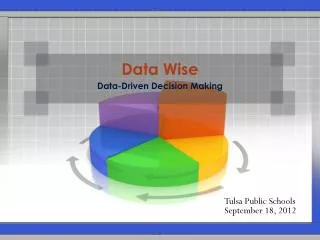
Central Tendency Relationship between the IV and DV Slope of Line (Rate of Change) Highs & Lows Differences & Similarities Error Analysis Data Analysis
Write the Data Analysis The trend seems to be that scores increase as the day progresses. The highest average was 98%; the lowest 67%. The range is 31; the mean 81.6%; the median 85; there is no mode. This could be because students are more awake and alert later in the day. It could also be that more “honor” students are in 3rd and 5th hours and this pulls up the average test scores. Further analysis should be done since some students were absent.
Data Analysis • As the IV (increases/ decreases) the DV (increases/decreases). • The trend of the graph is (positive/ negative) • The highest point is _______. The lowest point is ________. The difference between is _________. That means that__________________ _____________________________________________________.
Data Analysis • As the amount of fertilizer increases the plant height increases • The trend of the graph is positive which means that there is a strong relationship between fertilizer and plant height. • The highest point is 12 cm. The lowest point is 4 cm. The difference between them is 8 cm. That means that the more fertilizer used the higher the plant grows.
The average speed is ______________. • As the IV (increases/ decreases) the DV (increases/decreases). • The slope of the line is _____________ • The trend of the graph is (positive/ negative) • The highest point is _______. The lowest point is ________. The difference between these mean that _____________________________________________________.
What are four measures of central tendency? The four measures of central tendency are range, mean, median, and mode. • What can you describe about the relationship between the IV and DV? As the IV increases/ decreases the DV increases/ decreases. • What kind of graph has a slope? A line graph has a slope. • What can the slope tell you? The slope can tell the rate of change. • What can you summarize about a bar graph or curved line graph? For the line graph as the time increase the ball’s distance increased. • What can you compare about two points on a graph? On the line graph point 5 and point 11 are 6 meters apart. That is because as the time increased the distance from the starting point gets further away.
Exit Ticket What can you describe about the relationship between the IV and DV on graph #1?