Download

1 / 44
520 likes | 1.02k Views
Health Economics Tutorial. Krishan Patel. Disclaimer. Objectives of this session. Understand basic principles of economics Review and summarise the major topics which form the basis of exam questions Discuss up to 3 topics of popular concern!. Structure. Concepts in General Economics

E N D
Health Economics Tutorial Krishan Patel
Objectives of this session • Understand basic principles of economics • Review and summarise the major topics which form the basis of exam questions • Discuss up to 3 topics of popular concern!
Structure • Concepts in General Economics • Basic Principles (opportunity cost etc) • Markets (structure and forces) • Market failures (externalities) • Concepts in Health Economics • Market for healthcare • Economic evaluation • Decision analysis
Options! • 1) Basic Principles of Economics • 2) Utility and Indifference Curves • 3) Demand and Supply • 4) Elasticities • 5) Perfect Competition vs Monopolies • 6) Externalities and Social Welfare Loss • 7) Agency relationship & Supply Induced Demand • 8) Economic Evaluation (CBA/CEA/CUA) • 9) Decision Trees
Lecture 1 • Economics is based on a simple problem: • Resources are scarce • Human wants are infinite • Trade off! • Opportunity cost • “The cost of the next best opportunity foregone.” • Not literally a cost in terms of money
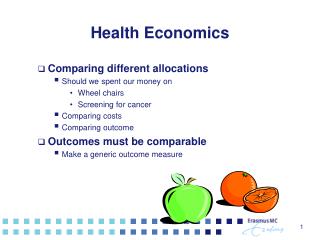
Jargon you need to know... • Economic Goods - scarce relative to our wants • Derived Demand • Utility • Diminishing marginal returns
Utility Number of chocolates eaten
Indifference curves Marginal Rate of Substitution... Basically if you were going to reduce the amount of nurses, how many more doctors would you need to maintain the same amount of utility Kit Kat c Y3=9 a Y1=7 U2 b Y2=5 U1 Y4=3 X1=5 X2=8 X3=10 X415 Kinder Bueno
Maximising utility when constrained by a budget Kit Kats [Good Y] 40 Y1 d e Y2 U2 U1 0 X1 X2 40 20 Kinder Bueno [Good X]
Utility Maximisation • MUn/Pn = MUgp/Pgp (…wtf) • MU/P means PRICE per unit of SATISFACTION • Marginal utility means the utility you get from consuming one more of the product • If the MU/P for KitKats was cheaper than MU/P for Kinder Bueno, you would buy more Kitkats because you could get more satisfaction (utility) • However, the more you have of something, the less added satisfaction you get by having one more • Marginal utility goes down...it becomes more expensive to get one more unit of utility by having more Kitkat • Eventually it will become the same price for a unit of utility...this is utility maximisation • MUn/MUgp = Pn/Pgp …Makes sense when you look at that graph again
Lecture 2 + 3 • Firms - Minimise costs of production + maximise profit • Profit = Total Revenue (TR) – Total Cost (TC) • Profit Maximisation: • Marginal Cost (MC) = Marginal Revenue (MR) • Diminishing marginal product – same principle as diminishing marginal utility • Meaning that...
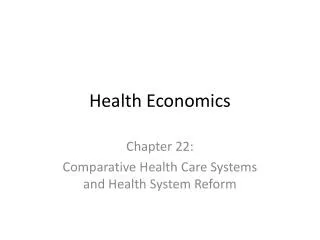
Quantity of output Number of Workers Hired
INPUTS! What’s the least number of workers you can get away with treating 200 patients. Q200 Number of outpatient procedures Number of nurses B A A OUTPUTS! What’s the max number of procedures you can do with a fixed number of workers B Q200 0 0 Number of doctors Number of inpatient procedures
Marginal Rate of Technical Substitution • ...eh?! • Think of it as the supply side version of marginal rate of substitution that you get with the utility curves early on.
Q0 Q1 Q2 Q2 Q1 Q0 Maximising output to a budget constraint Number of nurses N1 E N* Number of doctors 0 D1 D*
Demand • Demand – consumers • How much consumers are WILLING and ABLE to buy at any given price • SHIFT vs MOVEMENT – PIRATE • Population, Income, Related goods, Alternative, Tastes and fashion, Expectations • Normal vs Inferior good
Co-insurance Price per visit dWI $300 “Effective” demand “Nominal” demand $50 dWO $150 5 $25 Number of visits 10 15
Supply • Supply – producers • SHIFT vs MOVEMENT – CREWS • Complements, Raw materials, Expectations for future, Weather, Substitutes.
Supply Equilibrium Equilibrium price $20 Demand Equilibrium quantity Market Price Price 0 1 2 3 4 5 6 7 8 9 10 11 12 13 Quantity
S2 S1 Supply Supply New $2.50 New equilibrium equilibrium $2.50 $2.00 2.00 2.00 1.50 Initial Shortage equilibrium Demand D Demand D 4 7 10 Quantity Quantity 7 10 4 7 supplied demanded Price Supply Excess $700 $500 Price Price Price Demand 0 4 7 10 Quantity Quantity Quantity demanded supplied Initial equilibrium 0 Quantity Quantity 0 Quantity 0
Supply Consumer surplus Producer surplus Demand Price Surplus In an ideal world the price set by the market would prevail because this is where we maximise “surplus.” However, there are reasons why markets fail... Quantity 0
Demand $5 $4 Demand 4 100 Elasticity Price Price • Demand tends to be more elastic: • the larger the number of close substitutes. • if the good is a luxury. • the more narrowly defined the market. • the longer the time period. • Elasticity of supply...graphs look the same at both extremes • Ability of sellers to change the amount of the good • Time period Cross price elasticity: Substitutes and Complimentary goods (prescriptions & consultations) Income elasticity of demand: Inferior and Luxury goods (Healthcare has an income elasticity of >1 ...therefore it is a luxury good...discuss!) Quantity 0 Quantity 0
Perfect Competition – Perfect Market Full and perfect information – everyone knows everything about all the products Impersonal transactions – buyers and sellers have no relationships/bonds Private goods – only the person consuming the good is affected by it; they pays all the social costs and gain all the social benefits Selfish motivation – utility gained from consumption is for the individual only. Suppliers just want to make money. Many buyers and sellers – no single buyer or seller can influence the market price Free entry/exit – anyone can come into and out of the market with ease Homogenous products – all products within the market are identical No externalities – nobody else is affected by the production and consumption
The invisible hand of the market leads to an allocation of resources that makes total surplus as large as it can be. Because a monopoly leads to an allocation of resources different from that in a competitive market, the outcome must, in some way, fail to maximize total economic well-being. Monopoly vs Perfect Competition £ £ D D S=MC S=MC A PM C C Pc Pc D = AR D = AR 0 QM Qc Q 0 MR QM Qc Q Monopoly Perfect Competition Bottom line: Monopolies fail to allocate resources efficiently
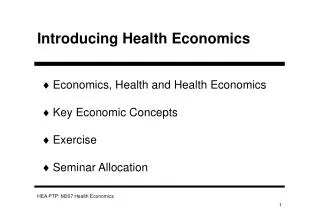
The price and quantity demanded by a perfect market takes into account all the effects on everyone. Therefore the price and quantity is at the SOCIAL OPTIMUM i.e. Social Cost = Social Benefit • However, we don’t care about others when we buy and sell things. We just care about our own costs and benefits i.e. Private Cost = Private Benefit • Examples: • Air pollution from a factory • The neighbor’s barking dog • Late-night stereo blasting from the dorm room next to yours • Noise pollution from construction projects • Health risk to others from second-hand smoke • Talking on cell phone while driving makes the roads less safe for others • All these things mean that other people are being affected by the consumption of our products. If our drive was for the economy to be perfectly efficient, then we should take these things into account when we decide what to consume and at what price. • If you look at the effect of this on a demand and supply graph... Externalities
Positive Externality in consumptione.g. production of electric cars P Deadweight Social Loss Total Gain to Other People MPC = MSC B Consumer Surplus A Equilibrium Price PA Producer Surplus MSB MPB Q QA QB Equilibrium Output Economically Efficient Output
Negative Externality in productione.g. production of cigarettes Price/ Cost MSC Deadweight social loss Social Cost B S (MPC) A Equilibrium Price PA D (MPB/MSB) QB QA Quantity Economically Efficient Output Equilibrium Output
This is what is meant by MARKET FAILURE! Pareto Efficient In a Pareto efficient economic allocation, no one can be made better off without making at least one individual worse off. MSC = MSB Pareto Improvement A change to a different allocation that makes at least one individual better off without making any other individual worse off. Internalizing an externality Altering incentives so that people take account of the external effects of their actions. e.g. Subsidies to persuade companies to produce more or taxes to persuade people to consume less.
Correcting the failure! Price + TAX = Private Cost = Social Cost Tax Price = Private Cost= Social Cost D = Private Benefit Social Benefit Read about the methods other than taxation... Command-and-control policies and Market-based policies Read about the advantages and disadvantages of each method... QP QS Cigarettes smoked per day, Q
Another way of drawing it... P MSC MPC B £5 A Tax £3 £1.5 MSB= MPB You influence the consumer to make him feel the extra social cost of smoking cigarettes and therefore change the amount he demands Q QB QA
Lecture 6 – Market Failure in Healthcare • Full information – but asymmetric information • Patients know better about their risks and behaviour • Doctors know better about treatment • Insurers - Asymmetry between patients and insurance and providers: • Averse selection (only high risk may buy insurance) – banding/compulsory • Consumer Moral hazard (people act differently after getting insured) – no claims bonus/consumer contribution • Producer Moral hazard (producer knows all costs will be covered so it becomes inefficient at using its resources) – regulation/prospective reimbursement • Impersonal– but relationship based on trust • Selfish– but concerns beyond self-interest – agency relationship • Doctor’s own interests • Supplier induced demand • Private goods – but public goods and externalities • Many buyers and sellers – but monopolies • Free entry – but professional entry requirements • Homogenous products – but product differentiation
Price Price Price Price Supply Supply Supply Supply Supply1 Supply1 Supply1 Supply1 Ps P P P P PS P1 P1 DemandS P1 P1 DemandS DemandS Demand Demand Demand Demand Q Q Q Q Q1 Q1 Q1 Q1 QS Qs Qs Quantity (eg. patient visits Quantity (eg. patient visits Quantity (eg. patient visits Quantity (eg. patient visits
Can only be sure if Q and P both rise But also with a more elastic demand with no SID! Price Price Supply Supply Supply Observed data Before and after the shock in Supply Price Price Can be consistent with SID! Supply1 Supply1 Supply1 Ps P P P P P1 P1 P1 P1 Demands P2 Demand Demands Demand Demand Q2 Q Q Q1 Q1 Q Q Q1 Q1 Qs Quantity (eg. patient visits Quantity (eg. patient visits) Quantity (eg. patient visits Quantity (eg. patient visits
Fairness in Healthcare • Public Good – (street lights, vaccinations) • non rival (one person consuming doesn’t affect another persons ability to consume) and non excludable (can’t give it to some and not others) – free rider problem • Merit Goods – (health care) • Would be under produced if left to the free market mechanism alone. • If health care can’t be allocated according to the market mechanism, then how do you decide who get’s what... • Sum-ranking – ‘the greatest happiness principle’ • e.g. maximise population health, happiness, wellbeing • Maximin – ‘the difference principle’ • e.g. give priority to those whose health is worse • Egalitarianism – equal distribution (goods, utility ?) • Fair Innings – everybody entitled to a normal span of life at a reasonable level of quality
How to distribute a tax • A tax is…. • proportional if the tax revenue increases by the same proportion of the increase in the subjects’ income: VAT (?) • progressiveif the tax revenue increases by a proportion largerthan the rate of increase of income: income tax • regressive if the tax revenue increases by a proportion smaller than the rate of increase of income: lump sum
Cost Benefit Analysis – Weighs up the costs and benefit of an option but uses money as the principle unit. Can’t quantify in monetary terms the benefit of a lot of health care treatments. Therefore, there is limited role for CBA. Decision to accept if: TB > TC TB-TC=NB>0 TB/TC>1 To take into account of the value today of future streams of costs and benefitNPV>0 Lecture 7 Cost Effectiveness Analysis – Weighs up an outcome based on a unit of benefit e.g. Amount of weight lost, amount of asthma free days, improvement of eyesight in dioptres. It can only compare procedures with the same unit of outcome. Cost Utility Analysis – Converts an outcome into a standard unit of benefit (utility) e.g. QUALY or DALY ICER – Used to compare the cost effectiveness of an intervention compared to its next best alternative In CEA – it could be the cost per Kg of weight lost In CUA – it could be the cost per QUALY Threshold – maximum willingness to pay per unit of benefit
Comparing ICER to a threshold Rc -Threshold At Rc, activity unacceptable Activity never acceptable At Rc, activity acceptable (-) Difference in costs (+) At Rc, activity unacceptable Activity always acceptable At Rc, activity acceptable (-) Difference in effects (+)
When it’s not such a clear cut decision... • Decision rule: • ∆C/∆E < Rcthe activity is cost effective • ∆C/∆E > Rcthe activity is not cost effective • Decision rule: • ∆C/∆E >Rcthe activity is cost effective • ∆C/∆E < Rcthe activity is not cost effective Technology that improves outcomes but is more expensive e.g. Robotic surgery Technology that decreases outcomes but is cheaper e.g. Stool screening rather than colonoscopy Minimum cost saving willing to accept to forgo 1 unit of outcome
QUALYs • Combines: • quality of life (QOL) • length of life (LOL) • Values health states over a period of time • Perfect health: 1 • Death: 0 • QALY= QOL x LOL • 2 years with health quality of 0.5 = one-year of optimal health (QOL=1) • Time Trade Off: If someone is indifferent between two states and one of them is QOLA = 1 then you can work out the value of QOLB • LOLA * QOLA = LOLB * QOLB • QOLB = LOLA / LOLB • Standard gamble – varying probabilities to tell you how much a certain state of health is worth to someone • Alternatives differ with respect to their timing – have to apply discounting. • Lower weight to costs and outcomes in the future discounted compared to those which occur in the present.
£500 .5 .5 £100 Lecture 8 - Decision Trees Expected Value of Node = (0.5x500)+(0.5x100) = 300 You use this to work out the ICER of your intervention You have to do it twice – once using QALYs and once using COST
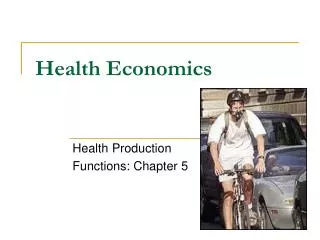
Decision Tree Transmission Intervention cost 800 800 0 0 0 0 Treatment cost 1500 0 1500 0 1500 0 P=0.07 Accept Expected cost= (0.07 × 2300) + (0.93 × 800) = 161+744=905 905 P=0.95 No Transmission P=0.93 Intervention 879.25 Expected cost= (0.95 × 905) + (0.05 × 390) = 859.75+19.5=879.25 Transmission P=0.26 390 Expected cost= [0.26 × 1500) + (0.74 × 0)=390 Do not Accept P=0.05 No Transmission P=0.74 Transmission P=0.26 390 No Intervention No Transmission P=0.74
Decision tree Transmission QALYS 5 40 5 40 5 40 P=0.07 Accept Expected outcomes= (0.07 × 5) + (0.93 × 40) = 0.35+37.2=37.55 37.55 P=0.95 No Transmission 37.2175 P=0.93 Intervention Expected cost= (0.95 × 37.55) + (0.05 × 30.9) =37.2175 Transmission 30.9 P=0.26 Expected cost= [0.26 × 5) + (0.74 × 40)=30.9 Do not Accept P=0.05 No Transmission P=0.74 Transmission 30.9 P=0.26 No Intervention No Transmission P=0.74
References Marisa Miraldo – Health Economics Slides 2012-13 Thank you to Marisa for providing us with great examples and teaching