Download
1 / 66
660 likes | 790 Views
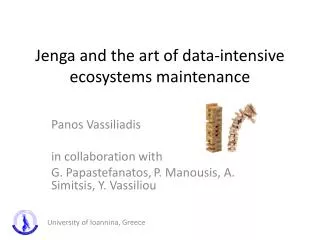
Making Order from Chaos: Using Metagenome Data as Traits in Individuals and as Markers in Entire Ecosystems“ . Andrew K Benson W.W. Marshall Distinguished Professor of Biotechnology Director, Core for Applied Genomics and Ecology Professor, Dept. of Food Science University of Nebraska.

E N D
Making Order from Chaos: Using Metagenome Data as Traits in Individuals and as Markers in Entire Ecosystems“ Andrew K Benson W.W. Marshall Distinguished Professor of Biotechnology Director, Core for Applied Genomics and Ecology Professor, Dept. of Food Science University of Nebraska
We Live in a World That is Numerically Dominated by Microorganisms Oceanic Phylloplane Oral Gastrointestinal Rhizosphere Food Soil Surface Water Rumen Ground Water
Organisms in these microbiomes contribute significantly to characteristics of these ecosystems Obesity Phylloplane Disease Resistance Inflammatory Bowel Disease Diabetes N2 Fixation Gastric and Colon cancers Rhizosphere
Significant variation in complexity of microbiomes from different ecosystems
Most of our understanding of these microbial ecosystems has relied on culture-based approaches to cultivate, differentiate and enumerate different species of microorganisms
High-throughput DNA sequencing technologies combined with other “omics” now allow systematic analysis of complex microbial communities Community composition 16S Microbiome Community Genetic Potential Metagenomics and Metaproteomics Community Physiology Metabolomics (nanoscale??) Community Dynamics Microbiomics + FISH Community interactions Microbiomics + FISH
Microbiome Metagenome Total genomic DNA Shotgun Library PCR amplify Tag gene (16S rRNA) 454 Pyrosequencing 454 Pyrosequencing
The 16S rRNA: the structural component of the Small Subunit and the most widely used molecular clock for bacteria V6 V3 Noller et al. 2001 Science V1- V2 ~54 recognized Phyla V4 V5 V8 V7
High throughput fecal DNA extraction Robotic extraction Attach gDNA To magnetic particles Centrifuge to Remove debris Lyse bacteria By homogenization With glass beads
Sample-specific barcodes gDNA from a sample A PCR amplify 16S rRNA gene B R357 16S 8F Pool from 96 samples and sequence
Quality Filtering Length >200 bases Barcode present 5’ 16S primer present Average Q = 20 TCTGCATG TCTGCATG GGAACTAA TCCTTAGG Trimming Remove barcode Remove 5’ primer Remove 3’ primer Remove 3’ adapter Sample 1 2 3 Barcode TCTGCATG GGAACTAA TCCTTAGG Reads
Strategies for data analysis • Define species composition and abundance in each sample • Define phylogenetic content (genetic diversity) in each sample • Quantitative analysis of the distribution of species abundances • and genetic diversity between two environments or through a • “gradient” of environments or in multiple environments
Sequences Amenable for high-throughput Kmer-based approaches Multiple Sequence Alignment BLAST Kmer-based Distances Kmer distribution Phylogenetic tree Nearest neighbor (bit score) CD-Hit RDP Classifier Last common ancestor With control sequences Search representative Sequence against database
Taxonomy-dependent analysis: RDP CLASSIFIER All 8 base words from training set of known taxa is calculated and The probability of these words occurring in a query sequence is calculated subset of words is used for probability calculation confidence of assignment is estimated by 100 reps of subsets (bootstrapping) ranking at higher order achieved by summing results from all taxon at lower level Prob of Kmers from training set Prob of Kmers from query AAAATTTT AAATTTTTT AATTTTTT Taxon 1 0.1 0.01 0 Taxon 2 0.15 0.03 0.05 Taxon 3 0.08 0.006 0 Taxon 4 0.012 0.1 0.003 Taxon 5 0.09 0.083 0.003 Taxon 6 0.048 0.03 0 Taxon 7 0.1 0.07 0.002 Taxon 8 0.004 0.02 0.01 Taxon 9 0.065 0.027 0.1 AAAATTTT AAATTTTTT AATTTTTT Query 1 0.1 0.01 0 Query 2 0.048 0.03 0 Query 3 0.065 0.027 0.1 Query 4 0.012 0.1 0.003 Query 5 0.09 0.083 0.003 Query 6 0.1 0.01 0
Taxonomy-independent analysis: CD-HIT • Aligns sequences by length and pulls longest sequence • Distance between this sequence and all remaining sequences estimated • from short word scores • Those sequences within defined threshold word score limit are • added to the cluster • Reiterate with remaining sequences Godzik Laboratory
Etsuko Moriyama Computer lab Core for Applied Genomics and Ecology Image analysis Base calling Instrument cluster Titanium cluster Data analysis CLASSIFIER OTU-PICKER BioServX Cluster Primary data collection Quality Filtering Database Upload 454 GutMicro Server
Search Functions Composite files and Send for analysis Pipelines
Taxonomy-dependent and Taxonomy independent pipelines For data analysis Final check on Samples in the experiment Composite Experiment files from Database available for analysis Set parameters And submit
Getting better at taxonomy-independent analysis Total genomic DNA PCR amplification V1-V2 region 16S rRNA gene Taxonomy-Dependent blind to taxa not in model Taxonomy-Independent too much data for true alignment
Data reduction and creation of “sloppy bins” Dereplicate Sequences to 97% Sample 1 (~10,000 reads) ~500 representative sequences ~500 representative sequences ~500 representative sequences ~500 representative sequences Sample 2 (~10,000 reads) Sample 3 (~10,000 reads) Sample 1,000 (~10,000 reads) Rep Rep Rep seq seq seq 1 2 3 Rep seq 1 1 0.986 0.786 Rep seq 2 1 0.693 Rep seq 3 1 Kmer-based Group distance matrix OTU 1 OTU2 OTU3 OTU4 OTU5 OTU6 Complete linkage clustering
Tightening up the OTUs with the secondary structure Aware Infernal Aligner E. P. Nawrocki, D. L. Kolbe, and S. R. Eddy, Infernal 1.0: Inference of RNA alignments Bioinformatics (2009), OTU 1 OTU2 OTU3 OTU4 OTU5 OTU6 cmAlign OTU Rep seqs Update Rep seq OTU file >Rep seq 1_OTU1 >Rep seq 2_OTU2 >Rep seq 3_OTU3 >Rep seq 50,000_OTU4 OTU1 OTU3 OTU4 OTU5 >Rep seq 1_OTU1 >Rep seq 2_OTU1 >Rep seq 3_OTU3 >Rep seq 50,000_OTU4
Quantifying abundance of ecological characteristics Complete linkage Clustering Sequences Alignment Quantitative analysis Of Taxa or OTUs Diversity estimates Rarefaction Chao, Shannon ANOVA and T-tests Confidence intervals
The Gastrointestinal tract ecosystem: the next frontier in biology Specialized cells and tissues for: Nutrient breakdown and adsorption Flow (peristalsis) Immune surveillance Neural connectivity Within this same complex of host tissues, a huge mass of microbes thrive. This mass is referred to as the microbiome
How complex is the microbiome Population density: 106 cells/ml in the ileum 1013 cells/gram in the colon Species richness: 5 major phyla, 1,800 genera, 2,000-10,000 species of bacteria Genetic coding content: 20-30 billion bases (10 times the human content) Highly variable between individuals: extensive variation at the species/strain level • The microbiome essentially acts as a metabolic organ, • encoding pathways for: • Nutrient breakdown, adsorption, utilization • Signaling within the microbiota and to the host • Immune stimulation/suppression…just to name a few
Fundamental questions about composition of the gut microbiome • Sterile at birth rapidly colonized from maternal environment • Successive waves of colonizationstabilizes to climax community after weaning • Some resistance to perturbation memory? • What factors influence composition—how much “G” and how much “E”? • Are there Keystone species? Mutualists? Engineers? • How do aberrations arise in composition? • What is more important, species composition or function?
Health Disease Heart disease Cancer Obesity Diabetes IBD
Anatomy of a polygenic complex disease Genetic predisposition Environmental factors Gene 1 Gene 2 Gene 3 Gene 4 Gene 5 Gene 6 Pathway 1 IBD Gene 100 Gene 158 Gene 573 Gene 744 Gene 2763 Gene 18950 Gene 21305 Gene 22481 Gene 24796 Pathway 2 Exercise Diet Gene A Gene B Gene C Pathway 3
Where does the gut microbiota fit in? Environmental factors Genetic predisposition Gene 1 Gene 2 Gene 3 Gene 4 Gene 5 Gene 6 Gut microbiota Gut microbiota IBD Gene 100 Gene 158 Gene 573 Gene 744 Gene 2763 Gene 18950 Gene 21305 Gene 22481 Gene 24796 Pathway 2 Exercise Diet Gene A Gene B Gene C Pathway 3
Changing how we think about disease susceptibility If the gut microbiota is associated (causally) with certain lifestyle diseases And If the gut microbiota is influenced by host genotype …Then genetic susceptibility to certain complex lifestyle diseases may be Manifest, in part, as predisposition to colonization by certain gut bacteria Metabolic effects Disease Gut microbiota
Systematic approaches to measure the degree of genotypic influence at the individual level • Selective Breeding Models • Genetic mapping models Artificial selection models If host genotype has significant influence… Then we should be able to observe significant effects of host genotype on microbiome composition in selective breeding experiments
Composition of gut microbiota in selective breeding lines Founder populations A (NIH) X B (ICR) B (ICR) X A (NIH) C (CF1) X D CFW(sw) D CFW(sw) X C (CF1) AB X CD BA X DC CD X AB DC X BA F1 15 generations Selection and Breeding (Heat loss) ~30 generations of closed breeding (no selection) 10 generations of renewed selection and breeding MH MC ML
Artificial selection models Multiple generations of selective mating Host genetic diversity high decreased genetic diversity If host genotype has significant influence… Then we should observe significant effects of artificial selection on microbiome composition
Did composition of the GI microbiome respond to selection? 16 animals per line (one line rep)pyrosequencing at 5,000-10,000 reads per animal
UNIFRAC analysis of 16S rRNA phylotypes from MH, ML, and MC CD-Hit and cluster analysis weighted UNIFRAC analysis MH + ML MH + ML MC MC
Rarefaction curves (97% cutoff) of microbiota from data pooled by line MC MH ML Phylotypes Number of sequences
Selective breeding compositional changes in gut microbiome (abundance of taxa) Compositional changes contributed to phenotype
What about direct evidence? If there is significant effect of host genotype, then it should behave as a polygenic phenotype: microbiome composition should co-segregate with multiple genomic markers in breeding populations Statistics and Bioinformatics Steve Kachman (STATS) Etsuko Moriyama (BioSci) Mouse Genomics Daniel Pomp (Univ. of North Carolina)
QTL mapping to identify genetic architecture controlling Composition of the gut microbiome X F1 F4 Genotyping SNPs Phenotyping454 sequencing 16S rRNA from poops
What is a trait with respect to gut microbiome? • Relative abundance of individual taxonomic ranks • Groups of taxa with positive or negative correlation
Outbred ICR Base population 30 Generations of Selective breeding High voluntary wheel running HR mice: Higher VO2 MAX Reduced Fatness Higher muscle glycogen Higher glycolytic and mitochondrial Enzyme activities
F4 Mapping population >800 animals Weaned at 3 weeks and caged by gender 7-8 weeks exercise cages Fecal samples collected at day 1 and day 6 In exercise cages Genotyping 768 fully informative markers Between ICR and B6 (present study stage at 550 QC’d Markers) Phenotyping 10,000 454 reads from each animal using V1-V2 Region, Taxonomy-assignment (RDP CLASSIFIER), normalized as proportion of total reads
QTLs mapped from 200 animals of the F4 cross 10 QTLs mapping to 7 chromosomes 4 different “compositional phenotypes”
Sometimes, you get lucky… QTLs on chromosome 15 control colonization by Helicobacter
Roadmap for the next two years Experiment N Sex SNPs Diet Parent Genetic of Origin Diversity 1a) C57 x HR F4 800 Both 768 Regular Y Low 1b) C57 x HR F10 400 Both 50 per QTL High Fat vs. Reg Y Low 2) Phenome Lines 400 Both 600,000+ Regular N Moderate 3) Collaborative 1600 Both 600,000+ High Fat vs. Reg Y High Cross Experiment N Sex SNPs Phenotypes Parent of Origin Collaborative 1000 Both 600,000+ Cancer Y Cross
Microbiome analysis (Class level) of 700 animals from the F4 mapping population
Are strong effects of host genetics conserved in plants? Plants also susceptible to infectious disease Microbiome of phylloplane (epiphytes and endophytes) May play protective role Much more prone to environmental variation?