Download
1 / 16
170 likes | 343 Views
When Your Heart Doesn't Work as It Should. The S-A node doesn't produce the right number of signals. Another part of the heart takes over as the natural pacemaker. The electrical pathways are interrupted. . When Your Heart Doesn't Work as It Should.

E N D
When Your Heart Doesn't Work as It Should • The S-A node doesn't produce the right number of signals. • Another part of the heart takes over as the natural pacemaker. • The electrical pathways are interrupted.
When Your Heart Doesn't Work as It Should • Slow Arrhythmias — When the heart beats too slowly it's called bradycardia (brady = slow, cardia = heart). • Slow arrhythmias can be a problem because they cause the oxygen- and nutrient-rich blood to travel more slowly to your organs and other tissues. • Your body may not receive enough oxygen and nutrients to function properly.
When Your Heart Doesn't Work as It Should • Fast Arrhythmias — When the heart beats too fast it's called tachycardia (tachy = fast, cardia = heart). • During tachycardia the heart isn't able to pump blood to the body as well as it should. • Fast rhythms in the upper chambers may not be life-threatening in themselves. • But they may contribute to other problems that are serious. • Fast arrhythmias in the lower chambers, the ventricles, can be dangerous and even fatal.
Tests for the Conduction System • ECG or EKG (Electrocardiogram) • Measure heart rate • Look for arrhythmias • Identify enlargement of the heart's chambers • Help diagnose whether you've had a heart attack
Electrical Activity • Of the heart is represented on an ECG. • ECG represent only electrical activity not the mechanical activity or actual pumping of the heart.
How to Read an EKG Strip • EKG paper is a grid where time is measured along the horizontal axis. • Each small square is 1 mm in length and represents 0.04 seconds. • Each larger square is 5 mm in length and represents 0.2 seconds.
How to Read an EKG Strip • Voltage is measured along the vertical axis. • 10 mm is equal to 1mV in voltage. • The diagram on the next slide illustrates the configuration of EKG graph paper and where to measure the components of the EKG wave form
Heart rate can be easily calculated from the EKG strip: • When the rhythm is regular, the heart rate is 300 divided by the number of large squares between the QRS complexes. • For example, if there are 4 large squares between regular QRS complexes, the heart rate is 75 (300/4=75).
Heart rate can be easily calculated from the EKG strip: • The second method can be used with an irregular rhythm to estimate the rate. Count the number of R waves in a 6 second strip and multiply by 10. • For example, if there are 7 R waves in a 6 second strip, the heart rate is 70 (7x10=70).
P wave * Indicates atrial depolarization, or contraction of the atrium. * Location: precedes the QRS complex * Amplitude (height) is no more than 3 mm * Duration: 0.06 to 0.12 seconds * Usually rounded and smooth
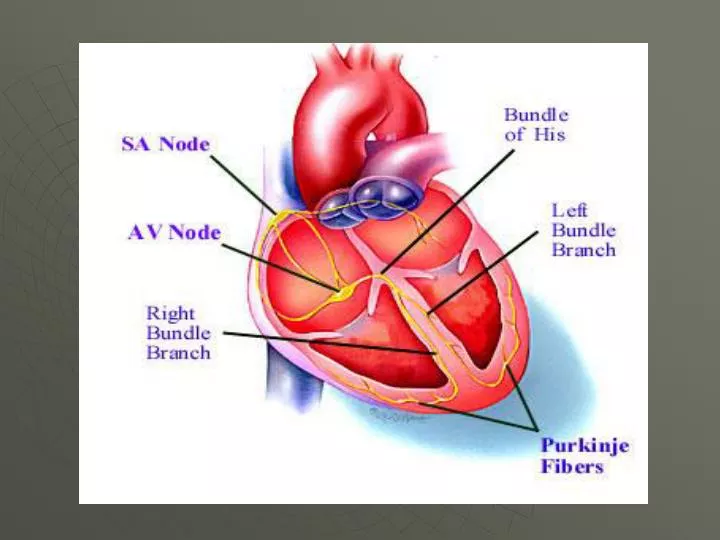
PR Interval • Tracks the atrial impulse from the atria through the AV node, bundle of His and right and left bundle branches. • Location: from the beginning of the P wave to the beginning of the QRS complex. • Duration 0.12 seconds to 0.20 seconds • Short intervals indicate that the impulse originated somewhere other than the SA node.
QRS complex • Indicates ventricular depolarization, or contraction of the ventricles. • Location: follows the PR interval • Amplitude: 5 to 30 mm high, but differs with each lead used. • Duration: 0.06 to 0.10 seconds or half of the PR interval measured from the beginning of the Q wave to the end of the S wave • R waves are deflected positively and the Q and S waves are negative
ST Segment • Represents the end of ventricular conduction or depolarization and the beginning of ventricular recover or repolariztion. • Location: extends from the S wave to the beginning of the T wave. • Deflection: usually on the baseline may vary from -0.5 to 1.0 mm. • A change in the ST segment may indicate myocardial injury or ischemia.
T wave • Indicates ventricular repolarization • Location: follows the ST segment • Amplitude: 0.5 mm in standard leads and 10 mm in precordial leads • Rounded and smooth