Download
1 / 16
160 likes | 177 Views
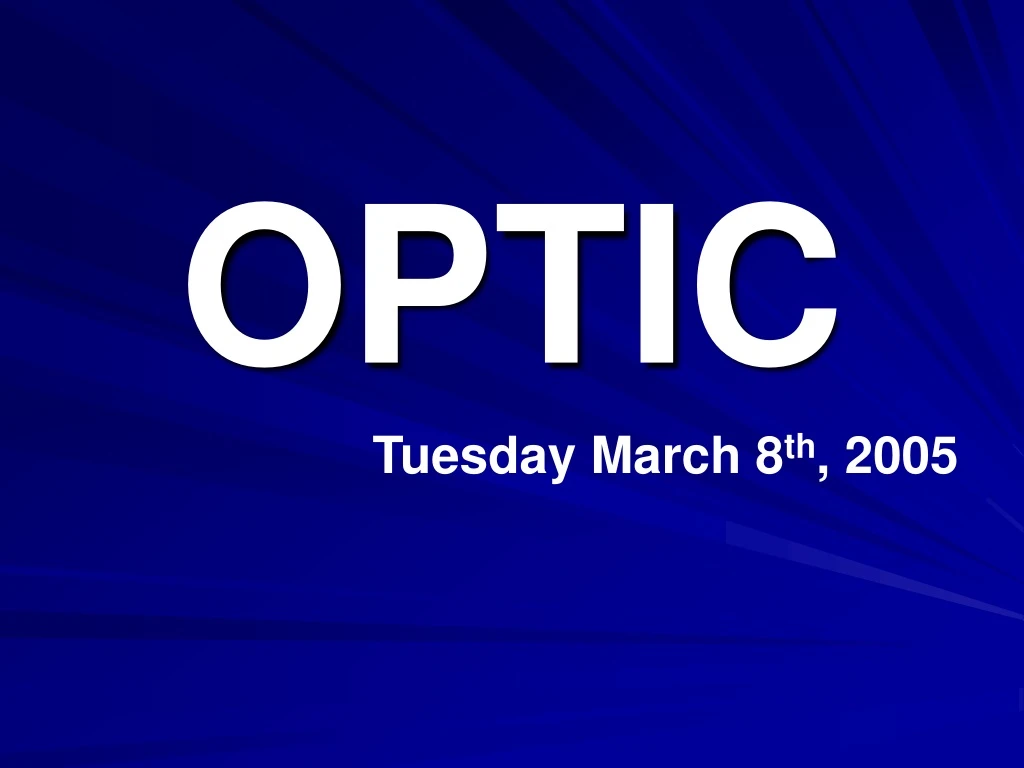
OPTIC. Tuesday March 8 th , 2005. OPTIC is a strategy developed by College Board for AP Vertical Team Work Designed to be used across the content areas and across grade levels. What is OPTIC?.

E N D
OPTIC Tuesday March 8th, 2005
OPTIC is a strategy developed by College Board for AP Vertical Team Work • Designed to be used across the content areas and across grade levels
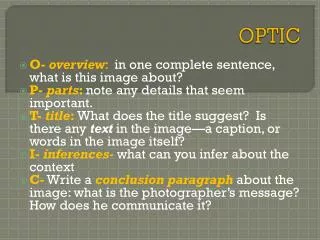
What is OPTIC? • OPTIC is an organizational strategy particularly suited for analyzing visuals and graphics. It can also be used to analyze readings and multiple choice questions. • Overview • Parts • Title/Topic • Interrelationships • Conclusion
General Benefits to Using OPTIC • OPTIC is the reverse of concept mapping and allows students to organize information. • Guides students in understanding and analyzing graphs, pictures, figures, data tables, multiple choice questions, paragraphs. • Can be integrated with Bloom’s Taxonomy to generate questions on each level of cognitive ability.
Why do OPTIC for Science? • 1/2 of science questions involve graphs/figures on Periodic Assessments are expected for next year (based on currently released middle school Periodic Assessments. • 1/3 of science questions involve graphs/figures on CST for science.
Why do OPTIC for math? • UCLA math coaches doing periodic math assessments have made note of the fact a large number of math questions involve graphs/figures on standardized testing (such as Periodic Assessments, CASHEE, and CST for math)
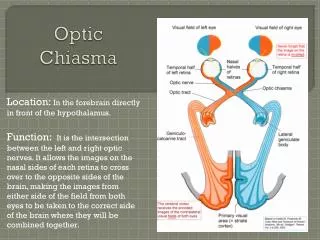
OPTIC for graphs Overview: What is your first impression of the graph? Parts: How many parts of the graph are there and what do they represent? Title: What is the title of the graph and what does it tell you about the graph? Interrelationships: What is going on in the graph? Conclusion: What is the graph trying to show us?
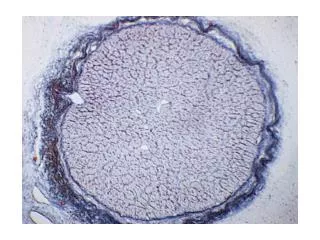
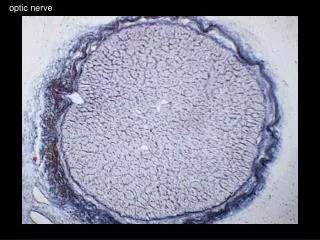
Carbon Isotopes Overview: What is your overall impression of the picture? Parts: What does the picture represent? Title: What is the title/caption of the picture and what does it tell you about the picture? Interrelationships: What is going on in the picture(s)? Conclusion: What is the picture trying to show us?
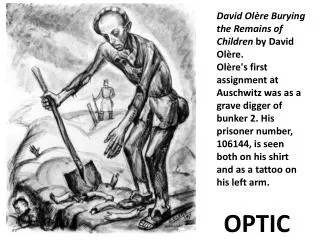
Caption: Migrant mother during the Dust Bowl in Oklahoma, circa 1930 O P T I C
OPTIC for a Written PassageUseful For Students to Complete Before they Complete Questions Based on the Passage. • Overview: Where is it from & what do you think it is about? • Parts: Who wrote the article & why are they writing it? • Title: What is the title of the passage and what does the title tell? • Interrelationships: What are the main issues/topics addressed in the reading? • Conclusion: What is the point of the passage?
OPTIC for a multiple choice question • Overview: Is there a chart, graph, written passage or picture that you need to use? • Parts: What are the parts of the chart, graph, picture, or writing prompt? • Topic: What is the question asking you about? • Interrelationships: What will help you answer the question? • Complete the Question
Different Ways To Incorporate OPTIC: Using OPTIC with Bloom’s Taxonomy • Remember ____________________ • Understand ____________________ • Apply _________________________ • Analyze _______________________ • Evaluate ______________________ • Create ________________________ Acid titration graph
Using OPTIC in Conjunction With Creating Multiple Choice Questions Acid titration graph Multiple Choice Questions O P T I C
Using OPTIC Within a Larger Project • During Labs • Students using OPTIC on graphs/data tables/figures that they have created during an experiment will help students better understand how to use a graph when analyzing their hypothesis. • During Group/Individual Projects • Students are able to better organize information from many sources when completing a project or culminating task.