Download
1 / 28
280 likes | 424 Views
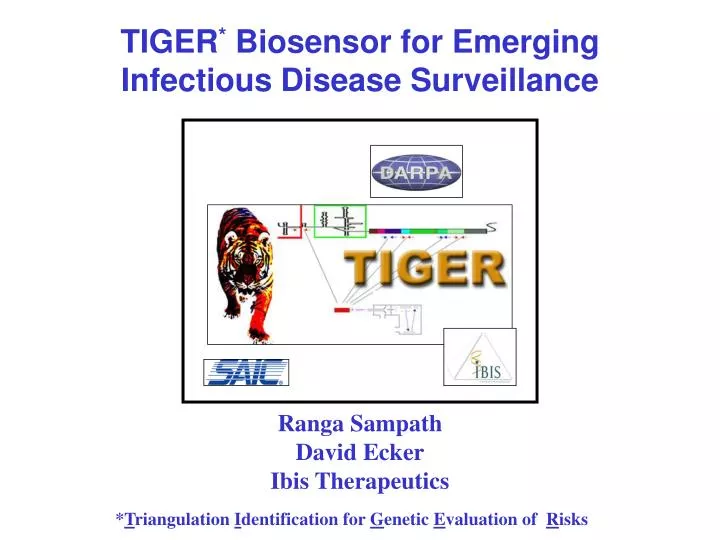
TIGER * Biosensor for Emerging Infectious Disease Surveillance. Ranga Sampath David Ecker Ibis Therapeutics. * T riangulation I dentification for G enetic E valuation of R isks. Infectious Disease Detection Today. Nucleic acid tests (NAT’s). Culture techniques

E N D
TIGER* Biosensor for Emerging Infectious Disease Surveillance Ranga Sampath David Ecker Ibis Therapeutics *Triangulation Identification for Genetic Evaluation of Risks
Infectious Disease Detection Today Nucleic acid tests (NAT’s) • Culture techniques • Detects a subset of all pathogens • Nucleic Acid Tests (NAT’s) • One test at a time (HIV, HCV, tuberculosis, etc.) • Need too many tests • Fail to detect newly emergent pathogens • There is currently no good method to detect organisms that have never been seen before
Problems Addressed by TIGER Animal Reservoirs of Infectious Agents Clinical Diagnostics/Biosurveillance Agricultural Diagnostics/ Biosurveillance Environmental Surveillance of Public Places
Triangulation Using Multiple Primer Pairs Correlated information from multiple primer pairs add redundancyand resolving power
“Back-Ends” to PCR • 1- 4 analyses per well • Hybridization-based detection based upon selected probes Taqman probes Chips • Thousands of analyses in parallel • Hybridization-based detection with selected probes • Thousands of analyses in parallel • Base composition detection without having to select probes • Information rich results
RNA Virus Families Detection and Classification of Coronavirus Species
Coronavirus Broad-range Primers RdRp Primer nsp11 Primer • Multiple primers selected based on alignment of all available sequences in Genbank in March 2003 • Primers target all known CoV species • Specificity verified using electronic PCR
ESI-FTICR Two Strands of a PCR Product (M-27H+)27- 27- 27- 29- 29- 25- 25- 31- 31- 23- 23- 1008.2 1008.6 1009.0 m/z
Base Compositions from Mass Spectra A27 G19 C14 T28 27125.542 27298.508 SARS CoV A22 G22 C14 T30 HCoV OC43 27098.562 27328.473 HCoV 229E 26975.512 27450.506 A25 G24 C11 T28 26900 27100 27300 27500 MW (Da)
Base Compositions as Virus Classifier -Resolution across viral groups • Base compositions are remarkably rich in information content • Corresponding regions from different viral families occupy distinct base composition space
Base Compositions as Virus Classifier -Resolution within a viral group A SARS CoV [A27 G19 C14 T28] = [-2A, +5G, -3C, 0T] HCoV 229E [A25 G24 C11 T28] = [-5A, +3G, 0C, +2T] = [-3A, -2G, +3C, +2T] G C HCoV OC43 [A22 G22 C14 T30] Rotate by T 28 30 • RNA viruses mutate • Multiple isolates could vary in sequence and composition
Base Compositions as Virus Classifier -Resolution within a viral group • Species variations modeled on HCV sequences • >100 complete genomes; multiple subtypes • Multiple TIGER-like primer regions analyzed • Derived classification probabilities based on observed changes HCV-1b (50 sequences X 6 regions) Non HCV-1b (50 sequences) Training Set (40 sequences) Test Set (10 sequences) Estimate pairwise sequence variation Derive probabilities for [A G C T] changes Threshold @ 95% sensitivity Average “Cloud”
Base Compositions as Virus Classifier -Resolution within a viral group A A [0 0 0 0] C [0 0 0 0] G C G • RNA viruses mutate • Most of these variations are constrained and not random • Species variations modeled on HCV sequences • >100 complete genomes; multiple subtypes • Multiple TIGER-like primer regions analyzed • Derived classification probabilities based on observed changes
Distribution of probabilities for HCoV 229E or OC43 variants A 18 34 14 10 6 32 30 SARS 28 HCoV 229E 26 24 22 20 G HCoV OC43 18 16 12 14 16 18 20 22 C 24 26 28 30 The probability of mis-assigning an unknown 229E or OC43 variant as SARS is nearly zero
Mixture sample of SARS, HCoV OC43, HCoV 229E HCoV 229E HCoV OC43 SARS CoV 26975.529 27125.544 27098.565 27450.518 27298.514 MIX 27328.483 26900 27100 27300 27500 MW (Da)
TIGER SensitivityMaximum Achievable by PCR 1 0.1 0.01 0.01 0.1 1 10 100 Probability of detection Genome Copies
Current Semi-Automated Process Collect Sample Suspend and/or Concentrate Lyse Drill-down PCR DNA Isolation PCR Preparation Signal Processing Analyze Results Cleanup Mass. Spec.
Future Automated Process Collect Sample Suspend and/or Concentrate Lyse Drill-down AutoSignal Processing
Conclusions • TIGER is a new paradigm for broad detection of infectious disease causative agents • Can detect and identify emerging infectious organisms • Detections are broad yet highly information rich • Sensitive to theoretical limit of PCR • High throughput (1800 samples/day/instrument) • Applications • Diagnosis of infectious agents in humans • Identification of animal reservoirs • Environmental surveillance of infectious agents
Exact Mass Measurements Facilitate Unambiguous Base Composition Determination AWGXCYTZ TWCXGYAZ ppm 0-25 50 100 250 500 # comp pairs 1 13 66 378 1447


![EVM System Surveillance Presented By: [NAMES] Presented to: [GROUP]](https://cdn2.slideserve.com/3705648/slide1-dt.jpg)