Download
1 / 23
230 likes | 417 Views
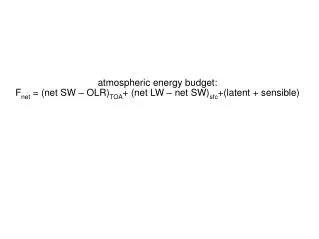
Urban Energy Budget. Geog301 Urban Climatology. Radiation Balance. Net radiation, Rn = (Q+q) (1- α ) + RL ↓ -RL ↑ , where Q and q are direct and diffuse solar radiation respectively, α is albedo and RL ↓ and RL ↑ are long-wave atmospheric and terrestrial radiation. Radiation balance.

E N D
Urban Energy Budget Geog301 Urban Climatology
Radiation Balance • Net radiation, Rn = (Q+q) (1- α) + RL ↓ -RL ↑ , where Q and q are direct and diffuse solar radiation respectively, α is albedo and RL↓ and RL ↑are long-wave atmospheric and terrestrial radiation.
Radiation balance Diffuse radiation (q: skylight; diffuse skylight; sky radiation): radiation reaching the earth’s surface after having been scattered from the direct solar beam by molecules or dusts in the atmosphere. (25% of direct light is scattered and 2/3 of them ultimately reaches the earth as diffuse sky radiation). In high latitudes, diffuse sky radiation comprises a very significant portion of the total radiation, approaching 100% for polar regions in winter. Solar radiation (direct): electronic magnetic waves. UV <0.4micro, visible 0.4-0.7 micro, infrared >0.7 micro.
Solar intensity, solar angle (physical geography book of Christopher, Fig 2.9), insolation-incoming solar radiation Elevated walls increase the solar angle and increase the solar intensity when solar angle is low.
Subsolar point: a latitude belt where direct solar rays hit. In Dec22-23, subsolar point is at southern most position (tropic of Capricorn), southern hemisphere has the highest solar radiation, NH has the smallest solar radiation. In June21-22, subsolar point is located on the northern most position (tropic of Cancer), maximum solar radiation at NH, minimum in SH.
Fig 2.7, annual mean of solar radiation as a function of latitude.
Albedo • Percentage of solar radiation reflected back from a surface (reflectivity of a surface) • forest albedo ranges 10-25%, short green vegetation ranges 10-20%; Concrete pavement ranges 15-35%, and asphalt pavement range 5-10% (table 4.2, p88; global physical climatology)
With low sun (lower solar angle), city’s vertical structures almost perpendicular to sun’s rays. More rays reflected to ground, not to the sky. albedo is greater in country than city (more solar energy received in the city). The city’s rocklike materials also store heat, making city warmer than rural. • With high sun (high solar angle), near mid-day, country receives more direct sunlight than city, results in lowered heat island.
RL↑at night, unobstructed view means greater outgoing energy, country cools faster than city. In city, pockets of air trapped, cannot move upward easily and still receiving heat released from energy stored in walls during day. Less sky view in city, hence even at dawn, city temperature is higher than rural. (Difference in temperature between city core and its surrounding called “heat island”.)
Terrestrial radiation: Stefan-Boltzmann’s law RL↑= σT4 (σ=5.67X10⁻⁸ w/m2/k4) • Higher the surface temperature, more radiation emitted
Greenhouse effect: the greenhouse gases (co2,h2o,ch4,O3,cfcs,n2o) absorb terrestrial (longwave) radiation warms up the atmosphere and re-radiation longwave radiation back to the surface and keep the surface warm. without greenhouse gases, earth’s mean temperature would be -4ºF(-20ºC), with greenhouse gases, the earth mean temperature is 59ºF(15ºC) Up to 85% (?) of greenhouse gases are emitted by cities
Impact of Pollution on Radiation Helps trap RL↑ at night, but can also reduce incoming insolation. (Q + q) is 15-20% less in cities, but not all wavelengths. Ultraviolet (UV) reduced much more than infrared. City UV is 30% less in winter, 5% in summer, on average. In smoggy LA, over 50% less, while in industrial cities, UV almost absent in winter. Insolation especially reduced with low sun, for example, high latitudes winter. Annual reduction: 9% Montreal, 7% Toronto. As pollution increases, less sunshine. London has reversed downward trend with Clean Air Act, with increased sunshine and disappearance of famous London fog.
RL↓.While RL ↓ greater in cities with warmer air and pollution, the warmer city also has greater RL↓
Other impacts on radiation: • Street design. Depth and width of canyon determine amounts of direct sunlight and shade. Walking below skyscrapers with narrow streets produces mostly shaded streets. • Orientation. E-facing walls gain remarkable amounts of energy in summer a.m. In winter, E and S-facing gain most heat in a.m. Nocturnal heat losses highest for E-facing walls, lowest for S-facing in a Japanese study.
Summary of radiation change in a city Rn = (Q+q) (1- α) + RL ↓ -RL ↑ Q is less q could more (1- α) is larger in low sun and smaller in high sun (α is lower in low sun and higher in high sun) RL ↓ is higher RL ↑ is lower Overall, Rn is higher? Definitely in evening
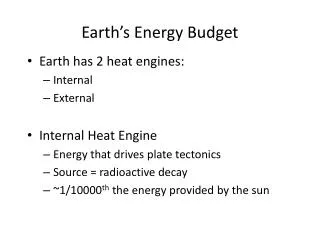
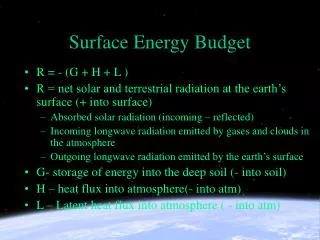
2. Earth’s Energy Budget (longwave radiation): Rn + F = LE + H + G, where F is artificial heat added, LE is latent heat, H is sensible heat and G is ground storage heat. • F. Adding to net energy gained and heat island is the heat generated by activities of city (heating buildings, residences, cars, air conditioners). • Sensible heat (H): heat directly related to air temperature change • Latent heat (LE): heat related to phase changes of water (not necessarily shows up in temperature change)
Anthropogenic heat (F). Inner city has greatest energy use. One Australian study had ratio of annual energy use in inner city to outlying sector of Sidney at about 360:1. Mid-latitude and high-lat. During winter, major source of heat is production of heat by city, not sun. Heat from industrial activities, house heating are important sources. For example, Manhattan Island, NY for Jan., city heats 2 ½ times greater than insolation reaching ground. Summer, ratio drops to 1:6.
Contributions to F • a. As temperature goes down, home heating increases. A average car burns about 3 gallons/hr. Combustion = heat of typical home furnace in winter. Could use car to heat home if given right exhaust system and heat exchanger. • b. People produce heat rate between 100 and 300 Watts, depending on activities. Not insignificant in a city of 10 million. Estimated that Boston-Washington megalopolis, with its 50-60 millions of population, in an area of 30,000 km2. Human heat source is about 65 cal./cm2/day or about 1/6 the amount received from sun.
Bowen ratio=H/LE Annual variation in the components of the surface energy budget at 1. West Palm Beach, Fl • Yuma, Arizona • Astoria, Oregon. (Fig 3.9, P52, Climatology handout).
Table 4.7 and 4.8, ground surface temperature (skin) and surface air temperature over Maryland