Download
1 / 2
20 likes | 148 Views
FA. R. Supplemental Figure 1 – Distribution of the LAT52::GUS signal near the point of pollen tube rupture. Ovules were processed as in Figure 2. Note the strong GUS signal close the tip of the pollen

E N D
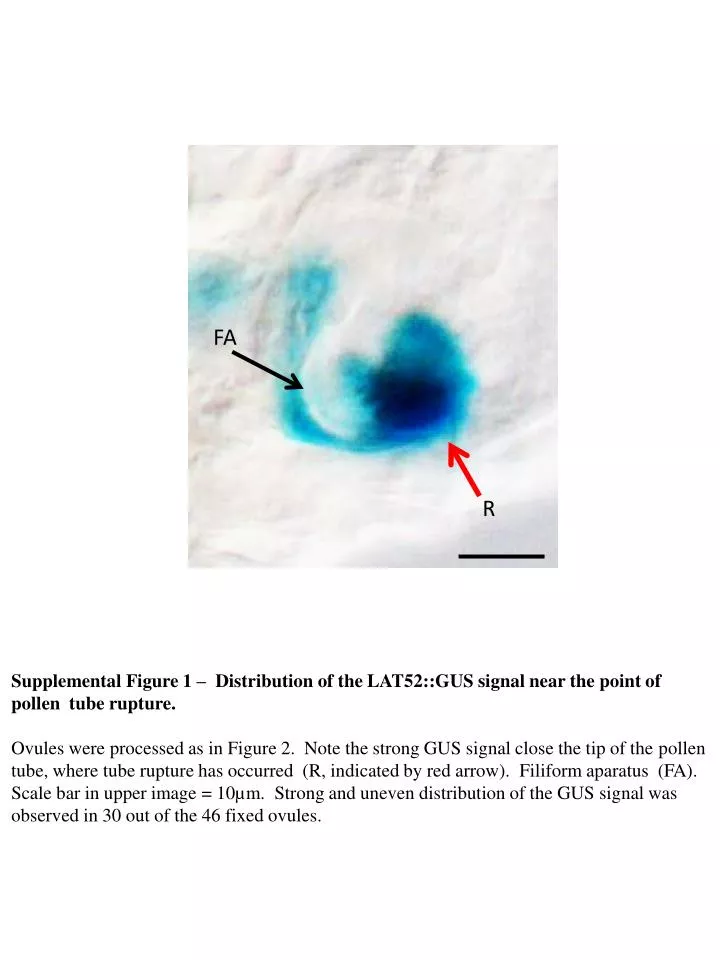
FA R Supplemental Figure 1 – Distribution of the LAT52::GUS signal near the point of pollen tube rupture. Ovules were processed as in Figure 2. Note the strong GUS signal close the tip of the pollen tube, where tube rupture has occurred (R, indicated by red arrow). Filiformaparatus (FA). Scale bar in upper image = 10µm. Strong and uneven distribution of the GUS signal was observed in 30 out of the 46 fixed ovules.
FA Supplemental Figure 2 – Growth of the pollen tube beyond the filiformappartus pole. Ovules were processed as in Figure 2. Note that the pollen tube seems to be growing deeper into the chalazal end of the synergid cell. Filiformaparatus (FA). Scale bar in upper image = 10µm. This growth pattern was observed in 3 ovules.