Download
1 / 35
350 likes | 354 Views
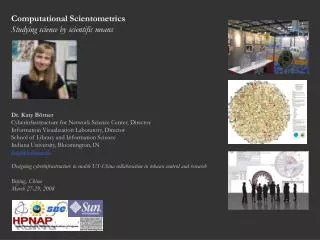
Information Visualization Course Class 2: User & task analysis. InfoVis Frameworks Katy Börner School of Library and Information Science. Recent IV Books. Readings in Information Visualization: Using Vision to Think by Stuart K. Card, Jock D. MacKinlay, Ben Shneiderman, 1999.

E N D
Information Visualization Course Class 2: User & task analysis. InfoVis Frameworks Katy Börner School of Library and Information Science
Recent IV Books Readings in Information Visualization: Using Vision to Think by Stuart K. Card, Jock D. MacKinlay, Ben Shneiderman, 1999. Information Visualization: Perception for Design by Colin Ware, Dec 1999 Information Visualisation and Virtual Environments by Chaomei Chen, Nov 1999 Information Visualization By Robert Spence, Oct 2000, http://www.booksites.net/spence http://www.ee.ic.ac.uk/research/information/www/Bobs.html Mapping Cyberspace by Martin Dodge and Rob Kitchin, Nov 2000 http://www.mappingcyberspace.com/ The Craft of Information Visualization: Readings and Reflections by Benjamin B. Bederson, Ben Shneiderman Information Visualization Course, Katy Börner, Indiana University
Journals Information Visualization http://www.palgrave-journals.com/ivs/ Presence http://www.presence-research.org/ IEEE Computer Graphics and Applications. http://www.computer.org/cga/ International Journal of Geographical Information Science. http://www.tandf.co.uk/journals/tf/13658816.html Journal of Computer-Mediated Communication http://jcmc.huji.ac.il/vol3/issue2/ Map of the Month columns at Mappa.Mundi Magazine http://mappa.mundi.net/maps Information Visualization Course, Katy Börner, Indiana University
Online Resources Olive: On-line Library of Information Visualization Environments http://otal.umd.edu/Olive/ Cyberatlas by Martin Dodge http://www.cybergeography.org/ Meta-index of Visualisation Pages http://industry.ebi.ac.uk/~alan/VisSupp/VisAware/VisAware.html Information Visualisation Resource http://www.cs.man.ac.uk/~ngg/resource.html See class web page http://ella.slis.indiana.edu/~katy/L579/ for more links. Information Visualization Course, Katy Börner, Indiana University
Conferences IEEE Symposium on Information Visualization (http://www.infovis.org/infovis2004/) International Conference on Information Visualization (http://www.graphicslink.demon.co.uk/IV05/) Conference on Visual Data Exploration and Analysis (http://vw.indiana.edu/vda2005/) EnVISION 2005: Exploring a New Visualization Infrastructure (http://vw.indiana.edu/envision05/) SIGGRAPH (http://www.siggraph.org/s2005/) Conference on Human Factors in Computing Systems International Conference on Human-Computer Interaction Intelligent User Interfaces Publications of the ACM include IEEE symposium and conference on IV, SIGGRAPH, SIGIR, SIGCHI Information Visualization Course, Katy Börner, Indiana University
Review • Developments that facilitate rapid growth of IV. • Benefits of well designed visualizations. • Scientific Visualization <> Information Visualization. • Why should one try to deconstruct visualizations? Information Visualization Course, Katy Börner, Indiana University
Readings Readings: • Nahum Gershon, Stephen G. Eick and Stuart Card (1998) Information visualization, Interactions March & April, pp 9-15. • I. Herman, M. S. Marshall, and G. Melançon (2000) Graph Visualisation and Navigation in Information Visualisation: A Survey, IEEE Transactions on Visualization and Computer Graphics, vol. 6, pp. 24-43. Information Visualization Course, Katy Börner, Indiana University
Information Visualization Course, Katy Börner, Indiana University From S. Card, IEEE IV04 Keynote.
User-Centered InfoVis Design First defines the • Intended user group and • The (sequence of) tasks & information needs of this user group that need to be supported. User & Task Analysis guided by InfoVis Frameworks. Then proceeds by • Selecting appropriate data mining and information visualization & interaction techniques. Algorithm Selection guided by InfoVis Frameworks. • Evaluating (and if needed redesigning) resulting visualizations/interfaces. (In)formalUsability Studies. Information Visualization Course, Katy Börner, Indiana University
1. User and Task Analysis Acquire info on users and their tasks using • Interviews • Questionnaires • Observation • Document analysis • Focus Groups Try to answer: • How do users conceptualize their world? • How do users see/interact with “their world” in this conceptualization? • What information needs do they have? Information Visualization Course, Katy Börner, Indiana University
User Analysis – What Info To Collect? • Who is the intended audience (profession, location, gender, age, or lifestyle preferences)? Describe your users' range of abilities -account for vision, hearing, mobility, or cognitive impairments. • What is their level of technical & subject expertise? Visual language used has to match the user's understanding of its function and/or content. • Do users have information preferences? Which pieces of information do users want first, second, third, and so on? • What are the user's information needs/tasks? Describe scenarios of use, or those situations or circumstances under which the IV may be used. • What is the visualization context? Describe your users' physical and social environments. Note any environmental challenges such as poor lighting or noise, and any technical challenges such as screen size and number of colors. Determine what hardware and browser software, monitors and screen resolutions your audience uses. In which work context will the IV be used? Information Visualization Course, Katy Börner, Indiana University
Task Analysis – Existing System • What problems exist with the current interfaces (tasks, information objects, actions)? • Prepare scenarios for each problem (use user terms not machine terms). • Which problems are significant? Rank problems. • How do users judge the result of their work? • How is the system embedded in the work context? Information Visualization Course, Katy Börner, Indiana University
Task Analysis – New System • Research how the potential users currently do their work. • Determine a set of goals belonging to the target user through observation and interviews. • Determine set of tasks that support these goals. Draw a diagram of the workflow. • Prioritize tasks based on criteria such as the importance of the goal to the organization and the frequency of task performance. Information Visualization Course, Katy Börner, Indiana University
Task Analysis: Hierarchical Task Decomposition • Decompose the highest priority tasks into their individual, atomic steps — the individual bits of work that a person does. (The level of decomposition varies with the budget and type of system evaluated.) • Suggest ways to make the task more efficient or suggests new tasks which more effectively support the goals. Information Visualization Course, Katy Börner, Indiana University
Task Analysis: Sample Information Needs Does visualization help identify • Trends in the data. • Outliers. • Jumps in the data (gaps). • Maxima and minima like largest, smallest, most recent, oldest, etc. • Boundaries (not the same as maxima or jumps). • Clusters in the data. • Structure in heterogeneous information. • A particular item of interest within the context of an enormous amount of contextual data. Information Visualization Course, Katy Börner, Indiana University
Task Analysis: Sample Tasks Wehrend’s task level user model: • Locate (search for a known object) • Identify (object is not necessarily known previously) • Distinguish • Categorize • Cluster • Distribution • Rank • Compare within entities • Compare between relations • Associate • Correlate (Source: Wehrend, S. and C. Lewis. 1990. A problem-oriented classification of visualization techniques Proceedings IEEE Visualization '90, October, pp.139 - 143, IEEE Computer Society Press) Information Visualization Course, Katy Börner, Indiana University
Task Analysis: Sample Tasks in Information Seeking Gary Marchionini (1992) describes a network of tasks that are performed in various, user-defined orders until the information-seeking problem is solved. Subtasks for the two basic forms of information needs - fact knowledge and browsing: • Define the problem. • Select the source. • Articulate the problem. • Examine the results. • Extract information. Grounded in traditional information retrieval paradigm - query formation and an iterative performance of steps to arrive at a satisfactory solution. (Source: Marchionini, G. 1992. Interfaces for end-user information seeking. Journal of the American Society for Information Science 43(2): 156-163.) Information Visualization Course, Katy Börner, Indiana University
3. Selection of InfoVis Techniques Use InfoVis frameworks to guide selection of data mining, visualization and interaction techniques based on the results of your user and task analysis. Don’t base your decision on • Availability of software tools. • Personal interest/preferences for tools. • People you like to work with. Information Visualization Course, Katy Börner, Indiana University
Shneiderman’s, 1996 Framework characterizes information visualization in terms of data types and user tasks to “sort out the prototypes [that currently exist] and guide researchers to new opportunities“: • Data types are linear, planar, volumetric, multidimensional, temporal, tree, network, and workspace*. • Task typology includes: overview, zoom, filter, details-on-demand, relate, history, and extract. Note: Both of these dimensions are very high-level, more qualitative than quantitative. (Source: Shneiderman, B. 1996. The eyes have it: a task by data type taxonomy for information visualizations. Proceedings of IEEE Symposium on Visual Languages, Boulder, CO, September 3-6, 336-343. * Added in his textbook (Shneiderman 1998)) Information Visualization Course, Katy Börner, Indiana University
Examples of different data types & systems Linear TileBars Hearst, 1995 2-dimensional Information Mural Jerding & Stasko 1995 Pad++ Bederson & Hollan 1994 Perspective Wall Mackinlay et al. 1991 Document Lens Robertson and Mackinlay 1993 3-dimensional WebBook Card et al. 1996 N-dimensional Bead Chalmers 1993, 1996 LyberWorld Hemmje et al. 1994 Themescape / SPIRE Wise et al. 1995 VIBE Olsen et al. 1993 VR-VIBE Benford et al. 1995 Information Visualization Course, Katy Börner, Indiana University
Temporal GroupKit Greenberg & Roseman SeeSoft Eick et al. 1992 LifeLines Plaisant et al. 1996 EditWear/ReadWear Hill & Hollan 1992 Hierarchical Cone/Cam-Trees Robertson et al. 1991 Hyperbolic Trees Lamping et al. 1995 3-D Hyperbolic Trees Munzer 1997 TreeMaps Johnson & Shneiderman 1991 Elastic Windows Kandogan & Shneiderman 1997 Information Visualization Course, Katy Börner, Indiana University
Network Butterfly Citation Browser Mackinlay et al. 1995 Influence Explorer Tweedie et al. 1996 Multi-Trees Furnas & Zacks 1994 Navigational View Builder Mukherjea & Foley 1995 SemNet Lin 1991, 1992 Distributed CASCADE Spring et al. 1996 GroupKit Greenberg & Roseman Web Forager Card et al. 1996 Information Visualization Course, Katy Börner, Indiana University
Taxonomy of Visualization Techniques by Ed H. Chi Information Visualization Course, Katy Börner, Indiana University
Keim, D. Visual Exploration of Large Data Sets. Communications of the ACM, Vol 44, No 8, Aug 2001.
Project 1 Information Visualization Course, Katy Börner, Indiana University
Katy’s favorite image #1Every year that a girl is born later she gains 3 months of extra life time.Oeppen J and Vaupel JW. Broken limits to life expectancy. Science. 296 (2002)5570: 1029-1031.
Project 2 Usability Studies Information Visualization Course, Katy Börner, Indiana University
Sample Web Directory Visualizations & Visualizing Search Results Information Visualization Course, Katy Börner, Indiana University