Download

1 / 18
180 likes | 322 Views
USGS Overview. Workshop on Improved Quality of Data and Data Exchange for Climate Research and Analysis NOAA National Climatic Data Center. Bill Hazell, Asheville Field Office Chief North Carolina Water Science Center United States Geological Survey.

E N D
USGS Overview Workshop on Improved Quality of Data and Data Exchange for Climate Research and Analysis NOAA National Climatic Data Center Bill Hazell, Asheville Field Office Chief North Carolina Water Science Center United States Geological Survey
First Gaging Station Established in 1889 Rio Grande near Embudo, New Mexico
The Embudo LegacyData collected using nationally consistent, prescribed standards
Data Dissemination – Real-Time Over 8,000 sites
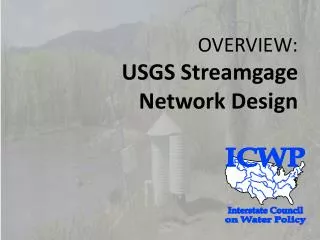
USGS Streamgaging Network • Monitoring streamflow in North Carolina since 1895 • Monitored and measured the benchmark floods including those of 1916, 1940, 1945, 1954, 1977, 1996, 1999, 2004 • Floyd the “Granddaddy” for eastern North Carolina
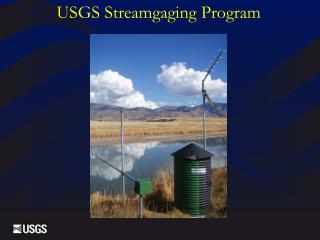
How a stream gage works • Basic piece of data collected at the streamgage is river stage or gage height • Stage data is available on the web at: nc.water.usgs.gov
How a stream gage works Discharge or Streamflow is the second key component and must be measured by USGS staff directly or indirectly at stream gages
How a stream gage works • River stage data is routinely transmitted via satellite every 1 to 4 hours and displayed on the internet. • During extreme events data can be transmitted as frequently as every 15 minutes
Stream Gaging and Flood Forecasting A Partnership of the U.S. Geological Survey and the National Weather Service U. S. Geological Survey Fact Sheet FS-066-95 NWS Flood Forecasts • Streamflow or discharge data are critical to the flood forecasting needs of the National Weather Service • Ninety-eight percent of stations used for real-time river forecasting are operated by the U S Geological Survey • The streamflow data are used in models for flood forecasting Measuring Streamflow on the French Broad River
Topics • Database • Flood Monitoring • Drought • Flood Inundation Maps