Download
1 / 16
160 likes | 236 Views
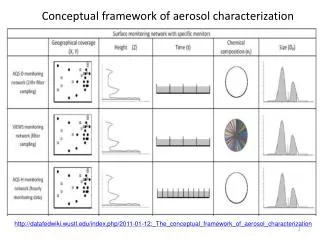
AMAZE2008 Amazonian Aerosol Characterization Experiment 7 Feb - 15 Mar 2008 Science Focus on Natural Ecosystem Functioning. Similarity Between Mass Spectra Observed in AMAZE-08 and SOM Particles Generated in Environmental Chamber. Campaign average. AMAZE-08 in Central Amazonia.

E N D
AMAZE2008 Amazonian Aerosol Characterization Experiment 7 Feb - 15 Mar 2008 Science Focus on Natural Ecosystem Functioning
Similarity Between Mass Spectra Observed in AMAZE-08 and SOM Particles Generated in Environmental Chamber Campaign average AMAZE-08 in Central Amazonia Organic: 0.63 μg m-3 Sulfate: 0.14 μg m-3 Organic Fraction: 0.78 Organic: 0.63 μg m-3 Sulfate: 0.14 μg m-3 Organic Fraction: 0.78 Chen et al., Geophys. Res. Lett., 2009, 36, L20806. SOM Particles of Ozonized α-Pinene Harvard Environmental Chamber Adapted from Chen et al., Geophys. Res. Lett., 2009, 36, L20806 and Shilling et al., Atmos. Chem. Phys., 2009, 9, 771-782.
Dominance of Secondary Organic Material in Submicron Particles OH NO3 O3 1. SEM 2. AMS O:C of 0.4 to 0.5, consistent with chamber SOA particles 4. AMS Similarity of measured mass spectra to those chamber SOA particles 5. AMS Absence of features for PBAPs 3. CCN Measured CCN activity accurately predicted using κorganic,SOA from lab results
Observations and Modeling of the Green Ocean Amazon Carbon Cycle Cloud Life Cycle Aerosol Life Cycle Presented by Scot Martin (Harvard) on behalf of Brazil and USA partners October 2012 DOE Workshop Seassionon Anthropogenic-Biogenic Interactions for SOA Production Climate Ecosystems Atmospheric Composition
Cloud Life Cycle, Aerosol Life Cycle, Aerosol-Cloud-Precipitation Interactions, Carbon Cycle are all represented in this schematic. GoAmazon2014: What is the effect of pollution on… these cycles and the coupling among them? Cloud Life Cycle, Aerosol Life Cycle, Aerosol-Cloud-Precipitation Interactions, Carbon Cycle are all represented in this schematic. GoAmazon2014: What is the effect of pollution on… these cycles and the coupling among them? Source: Pöschl, Martin, et al., "Rainforest aerosols as biogenic nuclei of clouds and precipitation in the Amazon," Science, 2010, 329, 1513-1516.
Dates of GoAmazon2014 • AMF Operations (T3 ground site) • 1 January until 31 December 2014 • AAF Operations (aircraft) • 15 February until 26 March 2014 (wet season) (75 hrs) • 1 September until 10 October 2014 (dry season) (75 hrs) • Aircraft operations correspond to the two intensive operating periodsplanned for the experiment.
Manaus: Vehicle Fleet 2010 • FUEL MIX: • tractor, truck and bus: almost 100% diesel • -car and bikes : > 60% gasoline (*) • (*) Ethanol price is very high in Manaus and gasoline is preferred by the consumer. Acknowledgments: Rodrigo Souza, UEA
Manaus: Power Plant 2009: Fuel Oil Hydropower Oils of different grades PTE - óleoleve "Para TurbinaElétrica" PGE - óleocombustível "Para GeradorElétrico" OCA-1 = Óleo Combustível com Alto teor de enxofre = Fuel Oil with High Sulfur Acknowledgments: Rodrigo Souza, UEA
Large Point Source of Pollution in Manaus: High-Sulfur Diesel for Electricity
NO2 Outflow from Manausin Aug 2010 observed by OMI Acknowledgments: Jun Wang, Univ. Nebraska
Downwind of Manaus • 111 by 60.8 km represented by this box. • Wind speeds at 1 km altitude are typically 10 to 30 kph. • T2→T3 transit time of 2 to 6 hr.
Downwind of Manaus The deployment site is situated in the steady trade winds such that it experiences the extremes of: (i) a pristine atmosphere when the Manaus pollution plume meanders; and (ii) heavy pollution and the interactions of that pollution with the natural environment when the plume regularly intersects the site. Reminder: GoAmazon2014 Theme: What is the effect of pollution on… these cycles and the coupling among them?
Reference: Kuhn, U.; Ganzeveld, L.; Thielmann, A.; Dindorf, T.; Welling, M.; Sciare, J.; Roberts, G.; Meixner, F. X.; Kesselmeier, J.; Lelieveld, J.; Ciccioli, P.; Kolle, O.; Lloyd, J.; Trentmann, J.; Artaxo, P.; Andreae, M. O., “Impact of Manaus City on the Amazon Green Ocean atmosphere: Ozone production, precursor sensitivity, and aerosol load,” Atmos. Chem. Phys. 2010, 10, 9251-9282.
Reference: Kuhn, U.; Ganzeveld, L.; Thielmann, A.; Dindorf, T.; Welling, M.; Sciare, J.; Roberts, G.; Meixner, F. X.; Kesselmeier, J.; Lelieveld, J.; Ciccioli, P.; Kolle, O.; Lloyd, J.; Trentmann, J.; Artaxo, P.; Andreae, M. O., “Impact of Manaus City on the Amazon Green Ocean atmosphere: Ozone production, precursor sensitivity, and aerosol load,” Atmos. Chem. Phys. 2010, 10, 9251-9282.
The chemistry can be completely shifted under anthropogenic influences… NOx concentration, SO2/H2SO4 particles HO2 ROOH NO2 ROONO2 RO· O2 OH NO RH R· ROO· RONO2 RO2