Download
1 / 7
70 likes | 157 Views
Organic Carbon during AMAZE-08: Preliminary model analysis. Colette L. Heald (heald@atmos.colostate.edu ). With observations from: Qi Chen & Scot Martin (Harvard University), Delphine Farmer & Jose Jimenez (CU Boulder), Thomas Karl & Alex Guenther (NCAR),

E N D
Organic Carbon during AMAZE-08:Preliminary model analysis Colette L. Heald (heald@atmos.colostate.edu) With observations from: Qi Chen & Scot Martin (Harvard University), Delphine Farmer & Jose Jimenez (CU Boulder), Thomas Karl & Alex Guenther (NCAR), Paulo Artaxo (University Sao Paulo) And discussion with: Andi Andreae, Tony Prenni AMAZE Science Team Meeting, Boulder July 24, 2008
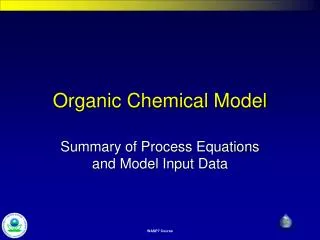
GEOS-Chem AEROSOL SIMULATION 2ºx2.5º global simulation with climatological emissions FEB: Surface Concentrations Site isolated from anthropogenic sources, monthly mean aerosol concentrations dominated by OC and dust…Unfortunately with consistent cloud cover, no satellite AOD available to validate distributions
ORGANIC CARBON: GEOS-Chem Simulated surface OC at site ~0.5-1 µg/m3, dominated by POA and monoterpene SOA. NOTE: there is no PBAP source here.
COMPARISON WITH AMS OBSERVATIONS Field site in Amazonia, Feb-Mar Early Feb: observe significantly more organic aerosol than simulated (rain ends this period) Observations = 1-4 µg/m3 Consistent air flow throughout campaign: Point #1: For majority of campaign GEOS-Chem simulates similar amount of OC (~1 µg/m3) Point #2: Observed concentrations are relatively low (somewhat explains #1) Point #3: There’s an interesting discrepancy early in the campaign….source?? Point #4: Consistent airflow throughout campaign simplifies analysis – no change in source influence
ARE FIRES A LIKELY SOURCE? Fires in the region during early Feb. These are not reflected in model emission inventories. Feb 1-9 Feb 21-29 MODIS fire counts: http://maps.geog.umd.edu/firms/maps.asp Elevated OC is coincident with elevated acetonitrile and potassium. MODIS detects actives fires in the immediate region.
…WHAT ABOUT FIRES IN AFRICA? Surface OC concentrations simulated by GEOS-Chem (with climatological fire source) Fires from early Feb transported across Atlantic? OC from African fires could be transported…or potassium from African dust?
CONCLUSIONS…(SO FAR) • No significant “unexplained” sub-micron OC observed at field site • Elevated OC in early Feb likely fire related • hope that a GEOS-Chem simulation with 2008 fire emissions can help determine if South American or African fire source is likely • Note that the AMS m/z 60 / Org ratio does not indicate a strong fire influence Interestingly, This leaves little room for underestimated BSOA formation or sub-micron PBAP How does this mesh with our thinking on PBAP? From Andi Andreae (unpublished data)