Download
1 / 27
270 likes | 354 Views
Algebra, Data, and Probability. Dr. Derek Webb Dr. Heidi Hansen Bemidji State University dwebb@bemidjistate.edu hhansen@bemidjistate.edu Faculty.bemidjistate.edu/ dwebb. Introductions. Name School Grades you teach Why are you here?. Communication.

E N D
Algebra, Data, and Probability Dr. Derek Webb Dr. Heidi Hansen Bemidji State University dwebb@bemidjistate.edu hhansen@bemidjistate.edu Faculty.bemidjistate.edu/dwebb
Introductions • Name • School • Grades you teach • Why are you here?
Communication • Are you (or have you ever been) part of mathematics curricular discussions K-12? K-5? • Were you involved in algebra readiness discussions given the recent move (Fall 2008) by MN to put a heavy algebra emphasis in 8th grade?
Survey • Pre test • Examination of Standards • National Council of Teachers of Mathematics • MN K-12 Academic Standards • Common Core State Standards • Algebra, Data, and Probability Content and Activities • Post test • Conclusions
Examination of Standards – NCTM Algebra Strand Instructional programs from prekindergarten through grade 12 should enable all students to • Understand patterns, relations, and functions • Represent and analyze mathematical situations and structures using algebraic symbols • Use mathematical models to represent and understand quantitative relationships • Analyze change in various contexts
Examination of Standards – NCTM Understand patterns, relations, and functions Pre-K–2 Expectations: • sort, classify, and order objects by size, number, and other properties; • recognize, describe, and extend patterns such as sequences of sounds and shapes or simple numeric patterns and translate from one representation to another; • analyze how both repeating and growing patterns are generated.
Examination of Standards – NCTM Represent and analyze mathematical situations and structures using algebraic symbols • illustrate general principles and properties of operations, such as commutativity, using specific numbers; • use concrete, pictorial, and verbal representations to develop an understanding of invented and conventional symbolic notations.
Examination of Standards – NCTM Use mathematical models to represent and understand quantitative relationships • model situations that involve the addition and subtraction of whole numbers, using objects, pictures, and symbols.
Examination of Standards – NCTM Analyze change in various contexts • describe qualitative change, such as a student's growing taller; • describe quantitative change, such as a student's growing two inches in one year.
Examination of Standards – MN Kindergarten Algebra – Recognize, create, complete, and extend patterns. • Identify, create, complete, and extend simple patterns using shape, color, size, number, sounds and movements. Patterns may be repeating, growing or shrinking such as ABB, ABB, ABB or ●,●●,●●●.
Examination of Standards – MN 1st Grade Algebra – Recognize and create patterns; use rules to describe patterns. • Create simple patterns using objects, pictures, numbers and rules. Identify possible rules to complete or extend patterns. Patterns may be repeating, growing or shrinking. Calculator can be used to create and explore patterns. For example: Describe rules that can be used to extend the pattern 2, 4, 6, 8, , , and complete the pattern 33, 43, , 63, , 83 or 20, , , 17.
Examination of Standards – MN 1st Grade Use number sentencesinvolving addition and subtraction basic facts to represent and solve real-world and mathematical problems; create real-world situations corresponding to number sentences. Determine if equations involving addition and subtraction are true.
Examination of Standards – MN 1st Grade Determine if equations involving addition and subtraction are true. For example: Determine if the following number sentences are true or false: 7 = 7 7 = 8 – 1 5 + 2 = 2 + 5 4 + 1 = 5 + 2.
NCTM vs. MN Standards NCTM Standards are broad and encourage multiple solutions MN Standards are more specific and encourage symbol manipulation and “drill and kill”
Examination of Standards – Common Core Which states have adopted Common Core? NCTM endorses Common Core Common Core is more similar to NCTM than to MN standards MN likely to adopt Common Core mathematics standards in the near future
How can I teach young children to think algebraically when they are just starting to learn arithmetic?
The ideas of algebra develop gradually throughout the PreK-12 experience. • Algebra should not be a new and sudden shock for students in 8th grade or high school. • Students are best served when your mathematics curriculum is fully articulated across the grades.
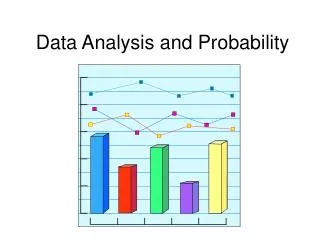
Examination of Standards – NCTM Data Analysis and Probability Strand Instructional programs from prekindergarten through grade 12 should enable all students to • Formulate questions that can be addressed with data and collect, organize, and display relevant data to answer them • Select and use appropriate statistical methods to analyze data • Develop and evaluate inferences and predictions that are based on data • Understand and apply basic concepts of probability
Examination of Standards – NCTM Data Analysis and Probability Strand: PreK - 2 • pose questions and gather data about themselves and their surroundings; • sort and classify objects according to their attributes and organize data about the objects; • represent data using concrete objects, pictures, and graphs.
Examination of Standards – NCTM Data Analysis and Probability Strand: PreK - 2 • describe parts of the data and the set of data as a whole to determine what the data show. • discuss events related to students' experiences as likely or unlikely.
Examination of Standards – NCTM Data Analysis and Probability Strand: 3 - 5 • design investigations to address a question and consider how data-collection methods affect the nature of the data set; • collect data using observations, surveys, and experiments; • represent data using tables and graphs such as line plots, bar graphs, and line graphs; • recognize the differences in representing categorical and numerical data.
Examination of Standards – NCTM Data Analysis and Probability Strand: 3 - 5 • describe the shape and important features of a set of data and compare related data sets, with an emphasis on how the data are distributed; • use measures of center, focusing on the median, and understand what each does and does not indicate about the data set; • compare different representations of the same data and evaluate how well each representation shows important aspects of the data.
Examination of Standards – NCTM Data Analysis and Probability Strand: 3 - 5 • propose and justify conclusions and predictions that are based on data and design studies to further investigate the conclusions or predictions. • describe events as likely or unlikely and discuss the degree of likelihood using such words as certain, equally likely, and impossible; • predict the probability of outcomes of simple experiments and test the predictions; • understand that the measure of the likelihood of an event can be represented by a number from 0 to 1.
Data Analysis and Probability – four key components to keep in mind: • Formulate questions • Collect data • Analyze data • Interpret results
Activities and lessons • Clown Line Up – Algebra readiness K/1 • Number roads and number lines – Algebra readiness K/1 • Ice cream sundae survey – just plain fun! • Likelihood vocabulary game • I Spy Patterns – Algebra readiness 4/5 • Probability basics • Geometric Patterns – Algebra readiness 4/5 • Probability hopper game – Probability 4/5