Download
1 / 42
420 likes | 621 Views
How to Power the World and U.S. With Wind, Water and Sunlight. Mark A. Ruffalo (Water Defense) Marco Krapels ( Rabobank ) Mark Z. Jacobson (Stanford University). Talks at Google Mountain View, California June 20, 2012. What’s the Problem? Why Act Quickly?.

E N D
How to Power the World and U.S. With Wind, Water and Sunlight Mark A. Ruffalo (Water Defense) Marco Krapels (Rabobank) Mark Z. Jacobson (Stanford University) Talks at Google Mountain View, California June 20, 2012
What’s the Problem? Why Act Quickly? Air pollution mortality is one of five leading causes of death worldwide Global temperatures are rising faster than during deglaciation at end of last ice age; Arctic sea ice is decreasing quickly Higher population and growing energy demand will result in higher energy prices and worse air pollution and climate problems over time.
Norilsk, Russia http://www.worldinterestingfacts.com/infrastructure/top-10-most-polluted-cities-in-the-world.html
Sukinda, India http://www.worldinterestingfacts.com/infrastructure/top-10-most-polluted-cities-in-the-world.html
Linfen, China http://www.worldinterestingfacts.com/infrastructure/top-10-most-polluted-cities-in-the-world.html
Lung of LA Teenage Nonsmoker in 1970s; Lungs of People in Most Big Cities of the World Today SCAQMD/CARB
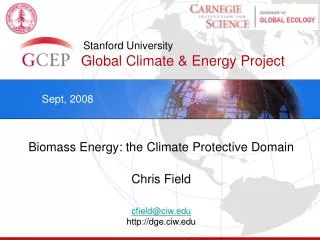
1900-2011 http://arctic.atmos.uiuc.edu/cryosphere/
Mean Global Temperature Anomalies • WARMEST YEARS • 2010 • 2005 • 2007 • 1998 • 2009 • 2011 • 2006 • 2003 • 2002 • 2004 NASA GISS, 2012
Cleanest Solutions to Global Warming, Air Pollution, Energy Security – Energy & Env. Sci, 2, 148 (2009) ELECTRIC POWER VEHICLES Recommended – Wind, Water, Sun (WWS) 1. Wind 2. CSP WWS-Battery-Electric 3. Geothermal 4. Tidal WWS-Hydrogen Fuel Cell 5. PV 6. Wave 7. Hydroelectricity Not Recommended Nuclear Corn, cellulosic, sugarcane ethanol Coal-CCS Soy, algae biodiesel Natural gas, biomass Compressed natural gas
Why Not Nuclear? 9-25 times more pollution per kWh than wind from mining & refining uranium and using fossil fuels for electricity during the 11-19 years to permit (6-10 y) and construct (4-9 y) nuclear plant compared with 2-5 years for a wind or solar farm Risk of meltdown (1.5% of all nuclear reactors to date have melted) Risk of nuclear weapons proliferation Unresolved waste issues
Why Not Clean Coal (With Carbon Capture)? 50 times more CO2 emissions per kWh than wind 150 times more air pollutant emissions per kWh than wind Requires 25% more energy, thus 25% more coal mining and transport and traditional pollution than normal coal.
Why Not Ethanol? Corn and cellulosic E85 cause same or higher air pollution as gasoline Corn E85: 90-200% of CO2 emissions of gasoline Cellulosic E85: 50-150% of CO2 emissions of gasoline Wind-BEVs: <1% of CO2 emissions as gasoline Enormous land use and water requirements
Why Not Natural Gas? 50-70 times more CO2 and air pollution emissions per kWh than wind Hydrofrackingcauses land and water supply degradation Methane leaks a leading cause of Arctic ice loss over next 20 years
Wind Power, Wind-Driven Wave Power www.mywindpowersystem.com
Hydroelectric, Geothermal, Tidal Power www.gizmag.com www.inhabitat.com myecoproject.org www.sir-ray.com
Concentrated Solar Power, PV Power TorresolGemasolar Spain, 15 hrs storage, Matthew Wright, Beyond Zero www.solarthermalmagazine.com i.treehugger.com
Electric/Hydrogen Fuel Cell Vehicles Tesla Roadster all electric Nissan Leaf all electric Tesla Model S all electric weeble.net www.blogcdn.com www.greenlaunches.com www.ecofriend.com www.blogcdn.com Hydrogen fuel cell bus Electric truck Hydrogen fuel cell–electric hybrid bus
Concentrated Solar Power, PV Power Ecofriend.org Ec.europa.eu Zmships.eu Electric ship upload.wikimedia.org
Air-Source Heat Pump, Air Source Electric Water Heater, Solar Water Pre-Heater Midlandpower.com Conservpros.com Adaptivebuilders.com Heat pump water heater
End Use Power Demand For All Purposes WORLDU.S. 2010 12.5 TW 2.50 TW 2030 with current fuels 16.9 TW 2.83 TW 2030 converting all energy To wind-water-sun (WWS) and electricty/H2 11.5 TW 1.78 TW (32% reduction) (37% reduction)
Number of Plants or Devices to Power World TECHNOLOGY PCT SUPPLY 2030NUMBER 5-MW wind turbines 50% 3.8 mill. (0.8% in place) 0.75-MW wave devices 1 720,000 100-MW geothermal plants 4 5350 (1.7% in place) 1300-MW hydro plants 4 900 (70% in place) 1-MW tidal turbines 1 490,000 3-kW Roof PV systems 6 1.7 billion 300-MW Solar PV plants 14 40,000 300-MW CSP plants 20 49,000 100%
Area to Power 100% of U.S. Onroad Vehicles Wind-BEV Footprint 1-2.8 km2 Turbine spacing 0.35-0.7% of US Nuclear-BEV 0.05-0.062% Footprint 33%of total; the rest is buffer Cellulosic E85 4.7-35.4% of US Geoth BEV 0.006-0.008% Solar PV-BEV 0.077-0.18% Corn E85 9.8-17.6% of US
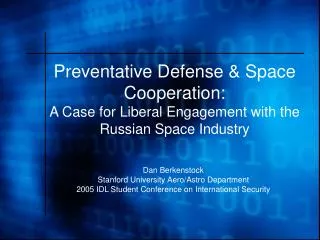
World Wind Speeds at 100m m/s 90 10 All wind over land in high-wind areas outside Antarctica ~ 70-80 TW = 6-7 times world end-use WWS power demand 2030 of 11.5 TW 8 0 6 4 -90 2 -180 -90 0 90 180
World Surface Solar m/s All solar over land in high-solar locations~ 340 TW = 30 times world end-use WWS power demand 2030 of 11.5 TW
End Use Power Demand For All Purposes In these tests, California electricity was obtained from WWS for 99.8% of all hours in 2005, 2006. Can oversize WWS capacity, use demand-response, forecast weather, use more CSP to reduce natural gas backup more. Hart and Jacobson (2011); www.stanford.edu/~ehart/
Resources for Nd2O3 (Tg) Used in Permanent Magnets for Wind Turbine Generators COUNTRYRESOURCESNeeded to power 50% of world with wind China 16 CIS 3.8 U.S. 2.1 Australia 1 India 0.2 Others 4.1 World 27.3 4.4 (0.1 Tg/yr for 44 years) Current production: 0.022 Tg/yr periodictable.com Jacobson & Delucchi (2011)
Resources for Lithium (Tg) Used in Batteries COUNTRY RESOURCES Possible number of vehicles @10kg/each Bolivia 9 with current known land resources Chile 7.5 China 5.4 U.S. 4 Argentina 2.6 Brazil 1 Other 3.5 World land 33 3.3 billion+ (currently 800 million) Oceans 240 www.saltsale.com Jacobson & Delucchi (2011)
Costs of Energy, Including Transmission (¢/kWh) ENERGY TECHNOLOGY 2008-2010 2020-2030 Wind onshore 4-7 ≤4 Wind offshore 10-17 8-13 Wave >>11 4-11 Geothermal 4-7 4-7 Hydroelectric 4 4 CSP 10-15 7-8 Solar PV 9-13 5-7 Tidal >>11 5-7 Conventional (+Externalities) 7 (+5.3)=12.3 8-9.6(+5.7)=13.7-15.3 Jacobson & Delucchi (2011)
Summary of Plan to Power World with WWS • Converting to Wind, Water, & Sun (WWS) and electricity/H2 will reduce global power demand by ~32% • Eliminates 2.5-3 million air pollution deaths/year • Eliminates global warming, provides energy stability • 2030 electricity cost 4-10¢/kWh for most, 8-13 for some WWS , • vs. fossil-fuel direct+externality cost ~13.5¢/kWh • Additional long-distance transmission (1200-2000 km) ~1¢/kWh
Summary of Plan to Power World with WWS Requires only 0.4% more of world land for footprint; 0.6% for spacing (vs. 40% of world land for cropland and pasture) Multiple methods of addressing WWS variability. Materials are not limits although recycling may be needed. Barriers : up-front costs, transmission needs, lobbying, politics. Papers: www.stanford.edu/group/efmh/jacobson/Articles/I/susenergy2030.html
Scientific conclusion: WWS can power the USA
Businesses need energy price stability and predictability. Oil and gas can’t provide that. Solar, wind and water can.
There's plenty of it: 1 hour of the sun's energy can power the planet for a year.
Elon Musk “all life on earth already is powered by the sun. We're next...”
Google definition of Fossil: An antiquated or stubbornly unchanging person or thing.
Over the last 100 years, trillions of dollar have been invested in building a fossil fuel dependent energy infrastructure.
Since 1960 the oil and gas industry has received $400 billion in US subsidies They are still receiving $4 billion per year…
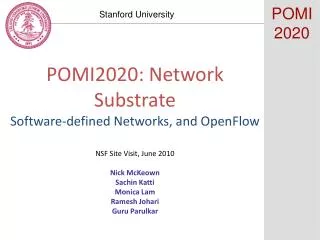
California Electricity Prices Outpace Inflation, 1970-2011 Source Data: *U.S. Energy Information Administration: California’s Average Retail Electricity Price **U.S. Bureau of Labor Statistics, Urban Consumer Price Index (rebased)
Rabobank, N.A. Committment to Renewable Energy: Direct Financing - Lakeside Dairy Key Facts: Location: Hanford, CA (Central Valley) System Size: 887 kW DC Configuration: Single-axis tracker Expected first year energy production: 1,716,851 kWh Utility Offset: Expected to replace 78% of utility power use at meter Power Equivalency: Solar production equal to 243 homes in California Lakeside Dairy is a family-run dairy operation with 6,300 head of cattle and a custom farming business. The recent volatility in milk prices has underlined the importance of hedging costs. The solar energy system enables Lakeside to hedge against long run increases in utility power rates, improving the client’s business and creditworthiness. The solar array is at the bottom of the picture at right.
Rabobank, N.A. Committment to Renewable Energy: Direct Financing - Castle Rock Key Facts: Location: Delano, CA (Central Valley) System Size: 1,184 kW DC Configuration: Fixed ground mount Expected first year energy production: 1,771,507 kWh Utility Offset: Expected to replace 69% of utility power use Power Equivalency: Solar production equal to 251 homes in California Castle Rock Vineyards is one of the world’s largest table grape growers. Many of Castle Rock’s European clients inquire about sustainability, making green technology and practices an integral part of Castle Rock’s business. Their solar energy system, financed by Rabobank, powers their cold storage facility. Rabobank structured the loan with a customized amortized loan to match the seasonality of solar energy production and associated state incentives. The value of avoided utility payments, combined with federal and state incentives, enables Castle Rock to generate net positive cash flow on a quarterly basis after loan payments. After the loan is paid off, Castle Rock’s savings will increase correspondingly. As utility electricity prices rise over time, their annual savings will increase.
Rabobank, N.A. Committment to Renewable Energy – Main Financial Drivers • Main Financial Subsidies/Benefits from Ownership of a Renewable Energy Project • 30% Investment Tax Credit or Cash Grant • The American Recovery and Reinvestment Act (ARRA) of 2009 allows eligible taxpayers to take an investment tax credit (ITC) or to receive a cash grant from the U.S. Treasury Department. • The grant in lieu of tax credit option falls under section 1603 of the ARRA and is only available to systems where construction began prior to December 31, 2011. • Depreciation Benefits • Business owned systems may be eligible for MACRS 5-year Accelerated Depreciation • The Tax Relief, Unemployment Insurance Reauthorization, and Job Creation Act of 2010 allows for 50% bonus depreciation in 2012 for projects placed in service for by December 31, 2012 • "Bonus Depreciation" means acceleration of the otherwise applicable depreciation (not "more" depreciation, but "sooner" depreciation) • Depreciable basis of a Renewable Energy System is 85% of project cost (the depreciable basis is reduced by one-half of the tax credit total or 15%) • Net Depreciation Impact: Assuming a 35% Federal Tax Rate, depreciation could account for approximately 30% of the cost of the renewable energy project • State Incentives • Based on the production of the renewable energy system • Incentives varies by state/utility; may account to 5%-10% of the total cost of the project
Mark A. Ruffalo (Water Defense) http://www.waterdefense.org/ Marco Krapels (Rabobank) http://www.rabobank.com/content/ Mark Z. Jacobson (Atmosphere/Energy Program, Stanford University) http://www.stanford.edu/group/efmh/jacobson/ http://www.stanford.edu/group/efmh/jacobson/Articles/I/susenergy2030.html