Download

1 / 42
420 likes | 425 Views
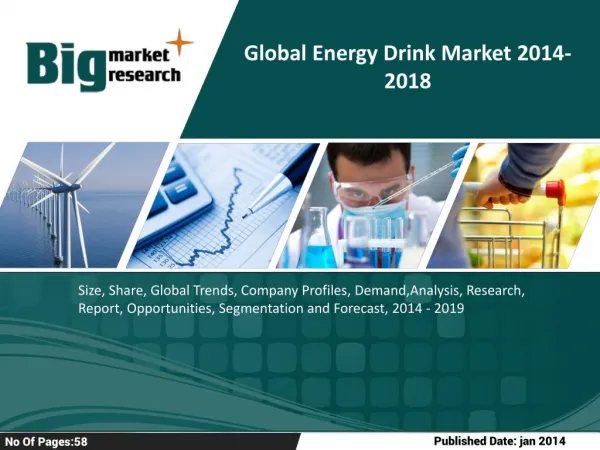
According to the MarkNtel Advisorsu2019 research report titled u201cGlobal Energy Drink Market Analysis, 2020u201d, the Global Energy Drink market is expected to surge at a CAGR of around 7.5% during 2020-25. <br><br>Full Market Insights-https://www.marknteladvisors.com/research-library/global-energy-drinks-market.html

E N D
Global Energy DrinkMarket Analysis, 2020 marknteladvisors.com
Document Outline Introduction About Us, Key Questions Answered In This Study 02 Table of Content Market Segmentation, Scope of Work 05 Research Process & Methodology Primary Research, Secondary Research, Companies Interviewed, Respondent Profile, Research Methodology, Forecasting 24 Sample Pages Global Energy Drink Market Analysis, 2020 32 Commercials 60 Disclaimer 62
Market Segmentation Global Energy Drink Market By Product Type By Target Consumer By Product By Trade Type • Organic • Non Organic • Natural • Teenagers • Adults • Geriatric • On Trade • Off Trade • Alcoholic • Non Alcoholic By Company By Region • Red Bull • Monster Beverages • Rockstar Inc • PepsiCo • Others • North America • United States • Canada • Mexico • South America • Brazil • Europe • Germany • UK • France • Italy • Spain • Russia & CIS • Middle East • Saudi Arabia • UAE • Qatar • Africa • Tukey • South Africa • Egypt • Asia Pacific • China • India • Japan • South Korea • South East Asia
Historical Year: 2015 Base Year: 2019 Forecast Year: 2025 Table of Content (1/17)
Historical Year: 2015 Base Year: 2019 Forecast Year: 2025 Table of Content (2/17)
Historical Year: 2015 Base Year: 2019 Forecast Year: 2025 Table of Content (3/17)
Historical Year: 2015 Base Year: 2019 Forecast Year: 2025 Table of Content (4/17)
Historical Year: 2015 Base Year: 2019 Forecast Year: 2025 Table of Content (5/17)
Historical Year: 2015 Base Year: 2019 Forecast Year: 2025 Table of Content (6/17)
Historical Year: 2015 Base Year: 2019 Forecast Year: 2025 Table of Content (7/17)
Historical Year: 2015 Base Year: 2019 Forecast Year: 2025 Table of Content (8/17)
Historical Year: 2015 Base Year: 2019 Forecast Year: 2025 Table of Content (9/17)
Historical Year: 2015 Base Year: 2019 Forecast Year: 2025 Table of Content (10/17)
Historical Year: 2015 Base Year: 2019 Forecast Year: 2025 Table of Content (11/17)
Historical Year: 2015 Base Year: 2019 Forecast Year: 2025 Table of Content (12/17)
Historical Year: 2015 Base Year: 2019 Forecast Year: 2025 Table of Content (13/17)
Historical Year: 2015 Base Year: 2019 Forecast Year: 2025 Table of Content (14/17)
Historical Year: 2015 Base Year: 2019 Forecast Year: 2025 Table of Content (15/17)
Historical Year: 2015 Base Year: 2019 Forecast Year: 2025 Table of Content (16/17)
Historical Year: 2015 Base Year: 2019 Forecast Year: 2025 Table of Content (17/17)
Document Outline Introduction About Us, Key Questions Answered In This Study 02 Table of Content Market Segmentation, Scope Of Work 05 Research Process & Methodology Primary Research, Secondary Research, Companies Interviewed, Respondent Profile, Research Methodology, Forecasting 24 Sample Pages Global Energy Drink Market Analysis, 2020 32 Commercials 60 Disclaimer 62
The History of Energy Drink Japan based company Taisho pharmaceutical introduced the First energy drink “Lipvitan-D” as a medicinal tonic drink which was specifically targeted at increasing energy. In 1987, Dietrich Mateschitz, an Austrian introduced “Red bull”. 1997- Redbull launched in United states. Debuts of Rockstar Energy drink Monster Energy Drinks launched by Hansen Natural Energy drinks are “downsized” into energy shots with the emergence of 5-Hour Energy Alcoholic Energy Drink 2004 1960 2002 1987- 1997 2001 The American Beverage Association convenes as agrees to label energy drinks as “conventional foods/beverages”, and not as dietary supplements. VPX Sports launched flavoured energy drink” BANG 357”. Fourloko was reintroduced in American market after removing ingredients caffeine, taurine, and guaran First alcoholic energy drink “Fourloko” was introduced . FDA bans energy drinks containing alcohol in various states 2012 2005 2014-19 2010 2010 Source: WHO
Energy Drink Vs. Common Caffeinated Drinks NORMAL CAFFEINATED DRINK
Global Energy Drink Market Outlook, By Revenues • Figure 1: Global Energy Drink Market Revenues (USD Million) & Quantity Sold (Million Liters), 2015- 2025F Revenue: XX% Quantity Sold: XX% Revenue: XX% Quantity Sold: XX% Source: MarkNtel Advisors • The global energy drink market is propelling with the rising disposable income coupled with increasing living standards. Moreover, the rise in the number of athletes, sports and fitness enthusiast and the rising trend of marathons, yoga, and aerobics leads to the change in dietary pattern and consumption of energy drink due to increasing awareness about healthy diet and maintain nutritional balance is contributing to the growth of the energy drink market. • Also, the introduction of energy drinks in various flavors such as Fruity and citrus flavors, tutti-frutti–type flavors, berry flavors, etc. are creating demand for the energy drink. Moreover, the demand for the alcoholic energy drink specifically from the millennium is the key factor contributing to the growth of the market
Global Energy Drink Market Revenue Share, By Product Type • Figure 3: Global Energy Drink Market Revenue Share (Percentage), Market Size (USD Bn), By Product Types, 2019 & 2025F Market Share (Percentage) 2025F 2019 Market Size (USD MN) Organic Segment is expected to grow at a CAGR of 7% during 2020-2025 Organic Non-Organic CAGR 2020-25 Natural *These are dummy charts and do not represent actual value Source: MarkNtel Advisors • Organic: The rising health awareness and trend of yoga, marathon coupled with escalating fitness and gym enthusiasts across the globe is proliferating the demand for the organic energy drink. Moreover, snowballing launches of organic energy drink in several flavors by the companies has resulted in the market for organic energy drink to witness an uptick across the globe. It was found that the new launch of energy drinks increased by 29% during 2010-15. For instance: In 2019, Dark dog launched the organic energy drink in the U.S. Also in the same year “Mati healthy energy” launched 3 new zero-calorie flavored organic energy drink. • Non-organic: The non-organic energy drink dominated the market in 2019 due to the lack of consumer awareness and the initial market penetration. Moreover, the economical price range in comparison to organic and natural energy drink are the prime factors driving the non-organic energy drink demand across the globe.
Global Energy Drink Market Revenue Share, By Product • Figure 4: Global Energy Drink Market Share (Percentage), Market Size (USD Bn), By Product, 2019 & 2025F Market Size (USD MN) Market Share (Percentage) Fastest growing segment CAGR: X% Key End: Benefits of Non- Alcoholic on account of Rising awareness and availability of Wider rage. 2025F 2019 Alcoholic Non-Alcoholic *These are dummy charts and do not represent actual value Source: MarkNtel Advisors • Non- Alcoholic: The non-alcoholic segment dominated the market on account of the rise in health awareness among consumers about the physical and psychological side effects of alcoholic energy drink is contributing to the growth of the market. Moreover, the government’s support to ban alcoholic energy drinks in various countries is the key factor driving the market for non-alcoholic energy drinks across the globe. For instance: the first alcoholic energy drink “Four Loko” was banned by the FDA and then reintroduced after removing the ingredients such as caffeine, taurine, and guaran. • Alcoholic: The surging trend of partying, dining out and get-together has resulted in an increased consumption for alcoholic energy drinks. The millennials have started considering energy drinks as a part of their status symbol, due to there is a high demand. Moreover, the easy availability of drinks with the emergence of the online platform, are amongst the demand contributors.
Global Energy Drink Market Revenue Share, By Target Consumer • Figure 5: Global Energy Drink Market Revenue Share, By Target Consumer, 2019 & 2025F Market Size (USD MN) Market Share (Percentage) Fastest growing segment CAGR: X% Key XX: Increasing trend of yoga, Gym, marathons. Also a rise in partying culture in developing nations. 2025F 2019 Teenagers Adults Geriatric *These are dummy charts and do not represent actual value Source: MarkNtel Advisors • Adults: The introduction of organic and natural energy drink gained the young consumer’s traction which is the largest consumer of energy drink. Moreover, the advertising and marketing strategies by the players in the industry play a vital role that makes the impact on energy drink sales from adults. • As per U.S. National Health and Nutrition Examination Survey between 2003-2016, the consumption of energy drinks by the young adults on a typical day rose from 0.5% to 5.5% and 0% to 1.2% among the middle-aged people. Moreover, the escalating trend of Zumba, yoga, marathon and rising number of sports and fitness enthusiasts across the globe are the key factors due to which the demand for the energy drink is generating in adults
Global Energy Drink Market Revenue Share, By Distribution Channel • Figure 6: Global Energy Drink Market Revenue Share, By Distribution Channel, 2019 & 2025F Market Size, 2019 (USD MN) Market Share (Percentage) • CAGR during 2019-25: XX% • Key End Users: Multi-Specialty hospitals and neonatal centers • Key Geographies: Europe 2025F 2019 • CAGR during 2019-25: XX% • Key End Users: Hospitals • Key Geographies: North America On Trade Off Trade *These are dummy charts and do not represent actual value Source: MarkNtel Advisors • On-Trade: The on-trade segment dominated the global energy drink market on account of the rising number of restaurants, hotels, coffee shops, bars, café, etc. Moreover, the mounting concept of QSR across the globe is contributing to the growth of the global energy drink market. Moreover, the companies are launching the dinks exclusive for on-trade. For instance, Monster energy launched “Monster Ultra” which was for on- trade in 2016. Moreover, the growing number of sociable millennials and party lovers are driving the on-trade sales market for energy drinks. • Off- Trade: The off-trade sales of energy drinks are growing at a significant pace on account of the rising number of supermarket/ hypermarket, convenience stores across the globe. The availability of several brands under one roof, discounts and promotional offers by the supermarkets/ hypermarkets are the key factors driving the off-trade energy drink’s market.
Global Energy Drink Market Revenue Share, By Region • Figure 10: Global Energy Drink Market Revenue Share, By Region, 2019 & 2025F North America South America Middle East & Africa AsiaPacific Europe • 2019: XX% • 2025F: XX% • 2019: XX% • 2025F: XX% • 2019: XX% • 2025F: XX% • 2019: XX% • 2025F: XX% • 2019: XX% • 2025F: XX% Source: MarkNtel Advisors
Global Energy Drink Market Revenue Share, By Company • Figure 20: Global Energy Drink Market Revenue Share, By Company, 2019 Market Share: XX% Market Share: XX% Market Share: XX% Market Share: XX% Market Share: XX% Source: MarkNtel Advisors Primary Surveys, Annual Reports, Press Releases
North America Energy Drink Market Outlook, By Revenues • Figure 12: North America Energy Drink Market Revenues (USD Million) & Quantity Sold (Million Litres), 2015- 2025F Revenue: XX% Quantity Sold: XX% Revenue: XX% Quantity Sold: XX% Source: MarkNtel Advisors • North America's energy drink market is escalating on account of growing awareness and needs for nutrients in the body due to improper diet. Moreover, the long working hours, hectic and busy lifestyle in the region is generating the need for the energy drink. According to the Bureau of Labour Statistics, an American work an average of 8.8 hours a day due the which the demand for the energy drink is witnessing an uptick in the region. • Moreover, the rising number of retail malls, supermarket/hypermarket and convenience stores in the region coupled with the increasing e-commerce operations across the region due to busy lifestyles and the presence of small retailers on the online platform and introduction of the mobile application are contributing to the growth of the market.
North America Energy Drink Market Revenue Share, By Product Type & Product • Figure 13: North America Energy Drink Market Revenue Share, By Product Types, 2019 & 2025F 2019 2025F *These are dummy charts and do not represent actual value Source: MarkNtel Advisors Organic Non-Organic • Table 5: North America Energy Drink Market Revenues (USD Million), By Product, 2015-2025F Natural Source: MarkNtel Advisors
North America Energy Drink Market Revenue Share, By Target Consumer & Distribution Channel • Figure 14: North America Energy Drink Market Revenue Share, By Target Consumer, 2015 - 2025 Source: MarkNtel Advisors On-Trade • Figure 15: North America Energy Drink Market Revenue Share, By Phototherapy Devices, 2019 & 2025F Off-Trade 2019 2025F Source: MarkNtel Advisors *These are dummy charts and do not represent actual value
North America Energy Drink Market Revenue Share, By Country • Figure 18: North America Energy Drink Market Revenue Share, By Country, 2019 & 2025F Source: MarkNtel Advisors
The United States Energy Drink Market Outlook, By Revenues • Figure 12: The United States Energy Drink Market Revenues (USD Million) & Quantity Sold (Million Litres), 2015- 2025F Revenue: XX% Quantity Sold: XX% Revenue: XX% Quantity Sold: XX% Source: MarkNtel Advisors • The rising number of convenience stores and the ubiquity of mobile phones is contributing to the growth of the energy drink market in the country. As per the National Association of Convenience Stores, the total convenience store count in the country increased from 1,52,794 to 1,54,958 during 2015-18. Moreover, increasing penetration of online delivery of the grocery in the region is contributing to the demand for the energy drink. For instance: Walmart is planning to deliver grocery items from 1600 locations by 2020. • Also, the escalating millennium population and health awareness among them is generating the need for the energy drink. Moreover, with the surging trend of yoga, marathon and gymnasts in the country end-users tend to pay more to keep themselves healthy that contributes to the growth of the energy drink market.
The United States Energy Drink Market Revenue Share, By Product Type & Product • Figure 13: North America Energy Drink Market Revenue Share, By Product Types, 2019 & 2025F 2019 2025F *These are dummy charts and do not represent actual value Source: MarkNtel Advisors Organic Non-Organic • Table 5: North America Energy Drink Market Revenues (USD Million), By Product, 2015-2025F Natural Source: MarkNtel Advisors *These are dummy charts and do not represent actual value
The United States Energy Drink Market Revenue Share, By Target Consumer & Distribution Channel • Figure 14: North America Energy Drink Market Revenue Share, By Target Consumer, 2015 - 2025 Source: MarkNtel Advisors *These are dummy charts and do not represent actual value On-Trade • Figure 15: North America Energy Drink Market Revenue Share, By Phototherapy Devices, 2019 & 2025F Off-Trade 2019 2025F Source: MarkNtel Advisors
Disclaimer MarkNtel Advisors provides market specific information that is intended for key sets of customers which can be used for internal purposes, but not for general publication or disclosure to third parties. No part of the report can be, lent, resold or disclosed to non-customers without written permission. No part may be reproduced, stored in a retrieval system or transmitted in any form or by any means, electronic, mechanical, photocopying, recording or otherwise, without the permission of the publisher. The Market specific information is based on primary interviews and MarkNtel Advisors takes no responsibility for any incorrect information provided to us. MarkNtel Advisors would not be held responsible for any loss or damage caused due to the usage of such information and thus would not refund in any case the amount spent by the company in purchasing such information. +1 (613) 707-5086 sales@marknteladvisors.com