Download
1 / 13
130 likes | 209 Views
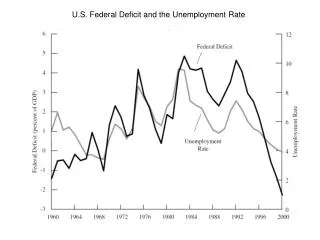
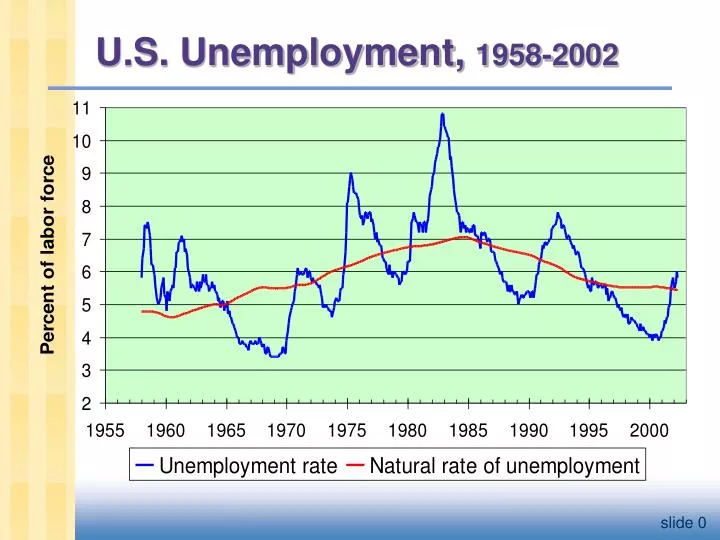
U.S. Unemployment, 1958-2002. Natural Rate of Unemployment. Natural rate of unemployment : the average rate of unemployment around which the economy fluctuates. In a recession, the actual unemployment rate rises above the natural rate.

E N D
Natural Rate of Unemployment • Natural rate of unemployment: the average rate of unemployment around which the economy fluctuates. • In a recession, the actual unemployment rate rises above the natural rate. • In a boom, the actual unemployment rate falls below the natural rate.
Example: • Each month, 1% of employed workers lose their jobs (s = 0.01) • Each month, 19% of unemployed workers find jobs (f = 0.19) • Find the natural rate of unemployment:
Why is there unemployment? • If job finding were instantaneous (f = 1), then all spells of unemployment would be brief, and the natural rate would be near zero. • There are two reasons why f < 1: 1. job search 2. wage rigidity
Job Search & Frictional Unemployment • frictional unemployment: caused by the time it takes workers to search for a job • occurs even when wages are flexible and there are enough jobs to go around • occurs because • workers have different abilities, preferences • jobs have different skill requirements • geographic mobility of workers not instantaneous • flow of information about vacancies and job candidates is imperfect
Sectoral shifts • def: changes in the composition of demand among industries or regions • example: Technological change increases demand for computer repair persons, decreases demand for typewriter repair persons • example: A new international trade agreement causes greater demand for workers in the export sectors and less demand for workers in import-competing sectors. • It takes time for workers to change sectors, so sectoral shifts cause frictional unemployment.
Sectoral shifts abound • more examples: • Late 1800s: decline of agriculture, increase in manufacturing • Late 1900s: relative decline of manufacturing, increase in service sector • 1970s energy crisis caused a shift in demand away from huge gas guzzlers toward smaller cars. • In our dynamic economy, smaller (though still significant) sectoral shifts occur frequently, contributing to frictional unemployment.
Supply Real wage Unemployment Rigid real wage Demand Labor Amount of labor hired Amount of labor willing to work Unemployment from real wage rigidity If the real wage is stuck above the eq’m level, then there aren’t enough jobs to go around.
The minimum wage in the real world: • In Sept 1996, the minimum wage was raised from $4.25 to $4.75. Here’s what happened: • Other studies: A 10% increase in the minimum wage increases teenage unemployment by 1-3%.
Labor unions • Unions exercise monopoly power to secure higher wages for their members. • When the union wage exceeds the eq’m wage, unemployment results. • Employed union workers are insiders whose interest is to keep wages high. • Unemployed non-union workers are outsiders and would prefer wages to be lower (so that labor demand would be high enough for them to get jobs).
industry # employed (1000s) U % of total RBU % of total wage ratio mining 531 12.3% 12.9% 103.4 construction 6,881 18.4 19.0 151.0 manufacturing 18,149 14.6 15.5 105.9 transportation 4,441 24.1 25.4 127.8 comm. and pub util 2,981 22.6 23.7 104.2 wholesale trade 4,540 5.5 5.9 105.8 retail trade 20,505 4.5 5.0 117.8 fin, insu, and real est 7,648 2.1 2.8 90.1 services 34,261 5.9 6.8 103.3 government 19,155 37.4 41.8 121.1 all 119,092 13.6% 15.0% 118.0 Union membership and wage ratios by industry, 2001 RBU = nonunion workers represented by a union wage ratio = 100(union + RBU wage)/(nonunion wage) slide 12