Download
1 / 1
10 likes | 92 Views
The Southeast Severe Weather Outbreak, March 1-2, 2007. Matthew S. Bloemer Florida State University, Department of Meteorology. What Happened.

E N D
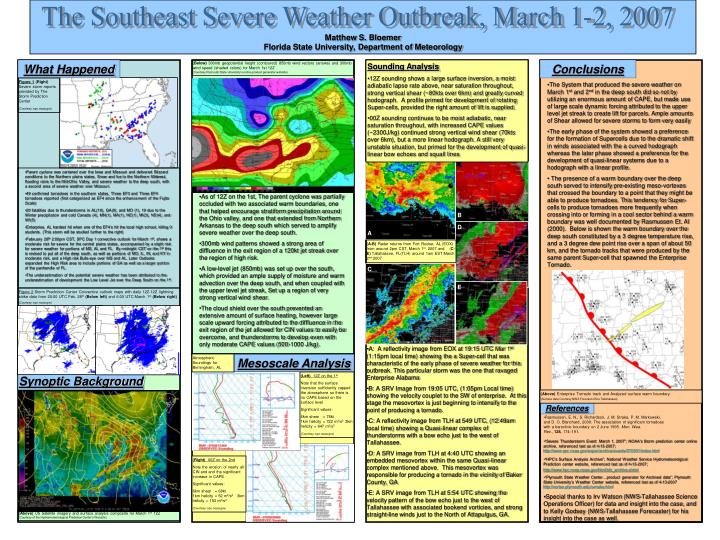
The Southeast Severe Weather Outbreak, March 1-2, 2007 Matthew S. Bloemer Florida State University, Department of Meteorology What Happened (Below) 300mb geopotential height (contoured) 850mb wind vectors (arrows) and 300mb wind speed (shaded colors) for March 1st 12Z (Courtesy Plymouth State University’s online product generator website) • Sounding Analysis • 12Z sounding shows a large surface inversion, a moist adiabatic lapse rate above, near saturation throughout, strong vertical shear (~80kts over 6km) and greatly curved hodograph. A profile primed for development of rotating Super-cells, provided the right amount of lift is supplied. • 00Z sounding continues to be moist adiabatic, near saturation throughout, with increased CAPE values (~2300J/kg) continued strong vertical wind shear (70kts over 6km), but a more linear hodograph. A still very unstable situation, but primed for the development of quasi-linear bow echoes and squall lines Conclusions Figure 1 (Right) Severe storm reports provided by The Storm Prediction Center (Courtesy: spc.noaa.gov) • The System that produced the severe weather on March 1st and 2nd in the deep south did so not by utilizing an enormous amount of CAPE, but made use of large scale dynamic forcing attributed to the upper level jet streak to create lift for parcels. Ample amounts of Shear allowed for severe storms to form very easily • The early phase of the system showed a preference for the formation of Supercells due to the dramatic shift in winds associated with the a curved hodograph whereas the later phase showed a preference for the development of quasi-linear systems due to a hodograph with a linear profile. • The presence of a warm boundary over the deep south served to intensify pre-existing meso-vortexes that crossed the boundary to a point that they might be able to produce tornadoes. This tendency for Super-cells to produce tornadoes more frequently when crossing into or forming in a cool sector behind a warm boundary was well documented by Rasmussen Et. Al (2000). Below is shown the warm boundary over the deep south constituted by a 3 degree temperature rise, and a 3 degree dew point rise over a span of about 50 km, and the tornado tracks that were produced by the same parent Super-cell that spawned the Enterprise Tornado. • Parent cyclone was centered over the Iowa and Missouri and delivered Blizzard conditions to the Northern plains states, Snow and Ice to the Northern Midwest, flooding rains to the Mid-Ohio Valley, and severe weather to the deep south, with a second area of severe weather over Missouri. • 49 confirmed tornadoes in the southern states, Three EF3 and Three EF4 tornadoes reported (first categorized as EF4 since the enhancement of the Fujita Scale) • 20 fatalities due to thunderstorms in AL(10), GA(9), and MO (1), 19 due to the Winter precipitation and cold Canada (4), MN(1), MA(1), NE(1), MI(3), ND(4), and WI(5) • Enterprise, AL hardest hit when one of the EF4’s hit the local high school, killing 9 students. (This storm will be studied further to the right) • February 28th 2:00pm CST, SPC Day 1 convective outlook for March 1st, shows a moderate risk for severe for the central plains states, accompanied by a slight risk for severe weather for portions of MS, AL and FL. By midnight CST on the 1st this is revised to put all of the deep south, as well as portions of MO, IL, IN, and KY in moderate risk, and a High risk Bulls-eye over MS and AL. Later Outlooks expanded the High Risk area to include portions of GA as well as a larger portion of the panhandle of FL. • The underestimation of the potential severe weather has been attributed to the underestimation of development the Low Level Jet over the Deep South on the 1st. • As of 12Z on the 1st, The parent cyclone was partially occluded with two associated warm boundaries, one that helped encourage stratiform precipitation around the Ohio valley, and one that extended from Northern Arkansas to the deep south which served to amplify severe weather over the deep south. • 300mb wind patterns showed a strong area of diffluence in the exit region of a 120kt jet streak over the region of high risk. • A low-level jet (850mb) was set up over the south, which provided an ample supply of moisture and warm advection over the deep south, and when coupled with the upper level jet streak, Set up a region of very strong vertical wind shear. • The cloud shield over the south prevented an extensive amount of surface heating, however large scale upward forcing attributed to the diffluence in the exit region of the jet allowed for CIN values to easily be overcome, and thunderstorms to develop even with only moderate CAPE values (500-1000 J/kg). B D A (A-B) Radar returns from Fort Rucker, AL (EOX) from around 2pm CST, March 1st 2007 and (C-E) Tallahassee, FL(TLH) around 1am EST March 2nd 2007 C E Figure 2 Storm Prediction Center Convective outlook maps with daily 12Z-12Z lightning strike data from 20:00 UTC Feb. 28th(Below left) and6:00 UTC March 1st (Below right) (Courtesy: spc.noaa.gov) • A: A reflectivity image from EOX at 19:15 UTC Mar 1st (1:15pm local time) showing the a Super-cell that was characteristic of the early phase of severe weather for this outbreak. This particular storm was the one that ravaged Enterprise Alabama • B: A SRV Image from 19:05 UTC, (1:05pm Local time) showing the velocity couplet to the SW of enterprise. At this stage the mesovortex is just beginning to intensify to the point of producing a tornado. • C: A reflectivity image from TLH at 549 UTC, (12:49am local time) showing a Quasi-linear complex of thunderstorms with a bow echo just to the west of Tallahassee. • D: A SRV image from TLH at 4:40 UTC showing an embedded mesovortex within the same Quasi-linear complex mentioned above. This mesovortex was responsible for producing a tornado in the vicinity of Baker County, GA • E: A SRV image from TLH at 5:54 UTC showing the velocity pattern of the bow echo just to the west of Tallahassee with associated bookend vorticies, and strong straight-line winds just to the North of Attapulgus, GA. Atmospheric Soundings for Birmingham, AL Mesoscale Analysis Synoptic Background (Left) 12Z on the 1st Note that the surface inversion sufficiently capped the atmosphere so there is no CAPE based on the surface level Significant values: 6km shear = 78kt 1km helicity = 722 m2/s2 3km helicity = 847 m2/s2 (Courtesy: spc.noaa.gov) (Above) Enterprise Tornado track and Analyzed surface warm boundary (Surface data Courtesy NWS Forecast office Tallahassee) References • Rasmussen, E. N., S. Richardson, J. M. Straka, P. M. Markowski, • and D. O. Blanchard, 2000: The association of significant tornadoes • with a baroclinic boundary on 2 June 1995. Mon. Wea. • Rev., 128, 174–191. • “Severe Thunderstorm Event: March 1, 2007”; NOAA’s Storm prediction center online archive, referenced last as of 4-13-2007; http://www.spc.noaa.gov/exper/archive/events/070301/index.html (Right) 00Z on the 2nd Note the erosion of nearly all CIN and and the significant increase in CAPE Significant values: 6km shear = 68kt 1km helicity = 52 m2/s2 3km helicity = 153 m2/s2 (Courtesy: spc.noaa.gov) • “HPC’s Surface Analysis Archive”; National Weather Service Hydrometeorolgical Prediction center website, referenced last as of 4-13-2007; http://www.hpc.ncep.noaa.gov/html/sfc_archive.shtml • “Plymouth State Weather Center…product generator for Archived data”; Plymouth State University’s Weather Center website, referenced last as of 4-13-2007 http://vortex.plymouth.edu/u-make.html • Special thanks to Irv Watson (NWS-Tallahassee Science Operations Officer) for data and insight into the case, and to Kelly Godsey (NWS-Tallahassee Forecaster) for his insight into the case as well. (Above) US Satellite imagery and surface analysis composite for March 1st 12Z (Courtesy of the Hydrometeorological Prediction Center’s Website)