Download

1 / 64
2.03k likes | 3.85k Views
ERT205 FLUID MECHANICS ENGINEERING. Prepared By: Samera Samsuddin Sah Biosystems Engineering Programme School of Bioprocess Engineering Universiti Malaysia Perlis ( UniMAP ). LIFT AND DRAG. 11–1 ■ INTRODUCTION.

E N D
ERT205 FLUID MECHANICS ENGINEERING Prepared By: SameraSamsuddinSah Biosystems Engineering Programme School of Bioprocess Engineering Universiti Malaysia Perlis (UniMAP) LIFT AND DRAG
11–1 ■INTRODUCTION • Fluid flow over solid bodies frequentlyoccurs in practice, and it is responsiblefor numerous physical phenomena such as • the drag forceacting on automobiles,power lines, trees, and underwaterpipelines; • the lift developed byairplane wings; • upward draftof rain, snow, hail, and dust particles in highwinds; • the transportation of red blood cells by blood flow; • the entrainmentand disbursement of liquid droplets by sprays; • the vibration and noise generatedby bodies moving in a fluid; and • the power generated by wind turbines.
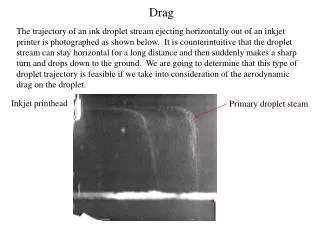
11–2■DRAG AND LIFT • A body meets some resistance when it is forced to move through a fluid, especially a liquid. • A fluid may exert forces and moments on a body in and about various directions. • Drag: The force a flowing fluid exerts on a body in the flow direction. • The drag force can be measured directly by simply attaching the body subjected to fluid flow to a calibrated spring and measuring the displacement in the flow direction. High winds knock down trees, powerlines, and even people as a result ofthe drag force.
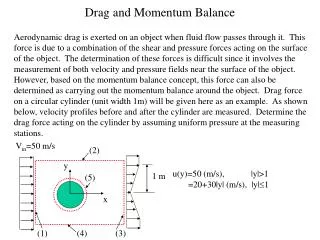
Lift:The components of the pressure andwall shear forces in the direction normal to the flow tend to move the bodyin that direction, and their sum is called lift. The fluid forces may generate moments and cause the body torotate. The pressure and viscous forces acting on a two-dimensional body and the resultant lift and drag forces.
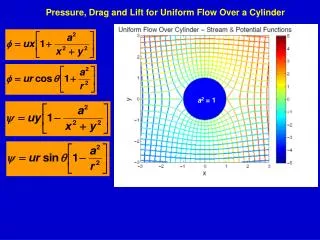
The drag and lift forces depend on the density of the fluid, the upstreamvelocity, and the size, shape, and orientation of the body. It is more convenient to work with appropriate dimensionlessnumbers that represent the drag and lift characteristics of the body. Thesenumbers are the drag coefficient CD, and the lift coefficient CL. During a free fall, a body reaches itsterminal velocity when the drag forceequals the weight of the body minusthe buoyant force.
11–3■FRICTION AND PRESSURE DRAG • The drag force is the net force exerted by afluid on a body in the direction of flow due to the combined effects of wallshear and pressure forces. • The part of drag that is due directly to wall shear stressis called theskin friction drag(or just friction drag) since it is caused by frictionaleffects, and the part that is due directly to pressureis called thepressure drag(also called the form dragbecause of its strong dependenceon the form or shape of the body).
The friction drag is the component of the wall shear force in the directionof flow, and thus it depends on the orientation of the body as well as themagnitude of the wall shear stress. • For parallel flow over a flat surface, the drag coefficient isequal to the friction drag coefficient. • Frictiondrag is a strong function of viscosity, and increases with increasingviscosity.
Reducing Drag by Streamlining Streamlining decreases pressure drag by delaying boundary layer separation and thus reducing the pressure difference between the front and back ofthe body but increases the friction drag by increasing the surface area. Theend result depends on which effect dominates. The variation of friction, pressure, andtotal drag coefficients of astreamlinedstrut with thickness-to-chord length ratio for Re = 4×10⁴. Note that CDfor airfoils andother thin bodies isbased on planformarea rather thanfrontal area.
The drag coefficientdecreases drastically as the ellipsebecomes slimmer. The reduction in thedrag coefficient at high aspect ratios is primarily due to theboundary layerstayingattached to the surface longer and the resulting pressurerecovery. Streamlining has the added benefit of reducing vibration and noise. Streamlining should be considered only for blunt bodies that are subjectedto high-velocity fluid flow (and thus high Reynolds numbers) for whichflow separation is a real possibility. Streamliningis not necessary for bodies that typicallyinvolve low Reynolds number flows. The variation of the drag coefficient of along elliptical cylinder with aspect ratio.Here CDis based on the frontal area bDwhere b is the width of the body.
Flow Separation Flow separation:At sufficiently high velocities, the fluid stream detaches itself from thesurface of the body. The location of the separation point depends on severalfactors such as the Reynolds number, the surface roughness, and the level offluctuations in the free stream, and it is usually difficult to predict exactlywhere separation will occur. Flow separation over a backward-facingstep along a wall. Flow separation in a waterfall.
Separated region:When a fluid separates from a body, it forms a separated region betweenthe body and the fluid stream. • This is a low-pressure region behind the bodywhere recirculating and backflows occur. • The larger the separated region, the larger the pressure drag. • The effects offlow separation are felt far downstream in the form of reduced velocity (relativeto the upstream velocity). • Wake:The region of flow trailing the body where theeffects of the body on velocity are felt. • Viscous androtational effects are the most significant in the boundary layer, the separatedregion, and the wake. Flow separation and the wake regionduring flow over a tennis ball.
At large angles of attack (usuallylarger than 15°), flow may separatecompletely from the top surface of anairfoil, reducing lift drastically andcausing the airfoil to stall. An important consequence of flow separation is the formation and sheddingof circulating fluid structures, called vortices, in the wake region. Theperiodic generation of these vorticesdownstream is referred to as vortexshedding. The vibrations generated by vortices nearthe body may cause the body to resonate todangerous levels.
11–4 ■DRAG COEFFICIENTSOF COMMON GEOMETRIES The drag behavior of various natural and human-made bodies is characterized by their drag coefficients measured under typical operating conditions. Usually the total (friction+pressure)drag coefficient is reported. The drag coefficient exhibits differentbehavior in the low (creeping),moderate (laminar), and high (turbulent) regions of the Reynolds number. The inertia effects are negligible in lowReynolds number flows (Re < 1),called creeping flows, and the fluid wraps around the body smoothly. Creeping flow, sphere Stokes law The drag coefficient for many (but notall) geometries remains essentiallyconstant at Reynolds numbers aboveabout 104. Stokes law is often applicable to dust particles in the air and suspended solid particles in water.
Observations from the drag coefficient tables The orientation of the body relative to the direction of flow has a major influence on the drag coefficient. For blunt bodies with sharp corners, such as flow over a rectangular block or a flat plate normal to flow, separation occurs at the edges of the front and back surfaces, with no significant change in the character of flow. Therefore, the drag coefficient of such bodies is nearly independent of the Reynolds number. The drag coefficient of a long rectangular rod can be reduced almost by half from 2.2 to 1.2 by rounding the corners. The drag coefficient of a body maychange drastically by changing thebody’sorientation (and thus shape)relative to the direction of flow.
Biological Systems and Drag The concept of drag also has important consequences for biological systems. The bodies of fish, especially the ones that swim fast forlong distances (such as dolphins), are highly streamlined to minimize drag(the drag coefficient of dolphins based on the wetted skin area is about0.0035, comparable to the value for a flat plate in turbulent flow). Airplanes, which look somewhat like big birds, retract theirwheels after takeoff in order to reduce drag and thus fuel consumption. The flexible structure of plants enablesthem to reduce drag at high windsby changing their shapes. Large flat leaves, for example, curl into a low-dragconical shape at high wind speeds, while tree branches cluster to reducedrag. Flexible trunks bend under the influence of the wind to reduce drag,and the bending moment is lowered by reducing frontalarea. Horse and bicycle riders lean forward as muchas they can to reduce drag. Birds teach us a lesson on dragreduction by extending their beakforward and folding their feetbackward during flight.
Drag Coefficients of Vehicles The drag coefficients of vehicles range from about 1.0 for large semitrailers to 0.4 for minivans, 0.3 for passenger cars, and 0.2 for race cars. The theoretical lower limit is about 0.1. In general, the more blunt the vehicle, the higher the drag coefficient. Installing a fairing reduces the drag coefficient of tractor-trailer rigs by about 20 percent by making the frontal surface more streamlined. As a rule of thumb, the percentage of fuel savings due to reduced drag is about half the percentage of drag reduction at highway speeds. Streamlines around anaerodynamically designed moderncar closely resemble the streamlinesaround the car in the ideal potentialflow (assumes negligible friction), except near the rear end, resultingin a low drag coefficient. This sleek-looking Toyota Prius has adrag coefficient of 0.26—one of thelowest for a passenger car.
The aerodynamic drag is negligible at low speeds, but becomessignificant at speeds above about 50km/h. At highway speeds, a driver can often save fuel in hot weatherby running the air conditioner instead of driving with the windows rolleddown. The turbulence and additional draggenerated by open windows consume more fuel than does the air conditioner. Superposition The shapes of many bodiesencountered in practice are not simple. But suchbodies can be treated conveniently in drag forcecalculations by consideringthem to be composed of two or more simple bodies. A satellite dish mountedon a roof with a cylindrical bar, for example, can be considered to be a combinationof a hemispherical body and a cylinder. Then the drag coefficient ofthe body can be determined approximately by usingsuperposition. The drag coefficients of bodiesfollowing other moving bodies closelycan be reduced considerably due todrafting (i.e., entering into the lowpressure region created by the bodyin front).
DiscussionAnswers are given to 2 significant digits. This example demonstratesthat significant reductions in drag and fuel consumption can beachieved by reducing the frontal area of a vehicle as well as its drag coefficient.
11–5■PARALLEL FLOW OVER FLAT PLATES Velocity boundary layer:The region of the flow above the plate bounded by in which the effects of the viscous shearing forces caused by fluid viscosity are felt. The boundary layer thickness is typically defined as the distance y from the surface at which u = 0.99V. The hypothetical curve of u = 0.99V divides the flow into two regions: Boundary layer region: The viscous effects and the velocity changes are significant. Irotational flow region: The frictional effects are negligible and the velocity remains essentially constant. The development of the boundary layer for flow over a flat plate, and the different flow regimes. Not to scale.
The turbulent boundary layer can be considered to consist of four regions, characterized by the distance from the wall: • viscous sublayer • buffer layer • overlap layer • turbulent layer Friction coefficient on a flat plate Friction force on a flat plate For parallel flow over a flat plate, thepressure drag is zero, and thus thedrag coefficient is equal to the frictioncoefficient and the drag force is equalto the friction force. The development of a boundarylayer on a surface is due to theno-slip condition and friction.
The transition from laminar to turbulent flow depends on the surfacegeometry, surface roughness, upstream velocity, surface temperature, andthe type of fluid, among other things, and is best characterized by theReynolds number. The Reynolds number at a distance x from the leadingedge of a flat plate is expressed as Vupstream velocity xcharacteristic length of thegeometry (for a flat plate, it is the length of the plate in the flow direction) For flow over a smooth flat plate, transition from laminar to turbulentbegins at about Re 1105, but does not become fully turbulent beforethe Reynolds number reaches much higher values, typically around 3106. In engineering analysis, a generally accepted value for the critical Reynoldsnumber is The actual value of the engineering critical Reynolds number for a flat platemay vary somewhat from about 105 to 3106 depending on the surfaceroughness, the turbulence level, and the variation of pressure along thesurface.
Friction Coefficient • The friction coefficient for laminar flow over a flat plate can be determinedtheoretically by solving the conservation of mass and momentum equationsnumerically. • For turbulent flow, it must be determined experimentallyand expressed by empirical correlations. The variation of the local frictioncoefficient for flow over a flat plate.Note that the vertical scale of theboundary layer is greatly exaggeratedin this sketch.
Average friction coefficient over the entire plate When the laminar flow region is not disregarded The average friction coefficient over asurface is determined by integratingthe local friction coefficient over theentire surface. The values shownhere are for a laminar flat plateboundary layer.
For laminar flow, the friction coefficientdepends only on the Reynolds number, and the surface roughness has noeffect. For turbulent flow, surface roughness causes the friction coefficientto increase severalfold, to the point that in the fully rough turbulentregime the friction coefficient is a function of surface roughness alone and isindependent of the Reynolds number. the surface roughness Lthe length of the plate in the flowdirection. This relation can be used for turbulentflow on rough surfaces for Re > 106, especially when/L >10−4. For turbulent flow, surface roughnessmay cause the friction coefficient toincrease severalfold.
Cfincreases severalfold withroughness in turbulent flow. Cfisindependent of the Reynolds number in the fully rough region. This chart isthe flat-plate analog of the Moody chart for pipe flows. Friction coefficient for parallel flowover smooth and rough flat platesfor both laminar and turbulent flows.
11–6■FLOW OVER CYLINDERS AND SPHERES Flow over cylinders and spheres is frequently encountered in practice. The tubes in a shell-and-tube heat exchanger involve both internalflow throughthe tubes and external flow over the tubes. Many sports suchas soccer, tennis, and golf involve flow over spherical balls. At very low velocities, the fluid completely wrapsaround the cylinder. Flowin the wake region is characterized by periodic vortex formation and low pressures. Laminar boundary layer separationwith a turbulent wake; flow over acircular cylinder at Re=2000.
For flow over cylinder or sphere, both the friction drag and the pressure drag can be significant. The high pressure in the vicinity of the stagnation point and the low pressure on the opposite side in the wake produce a net force on the body in the direction of flow. The drag force is primarily due to friction drag at low Reynolds numbers (Re<10) and to pressure drag at high Reynolds numbers (Re>5000). Both effects are significant at intermediate Reynolds numbers. Average drag coefficient for cross-flow over a smooth circular cylinderand a smooth sphere.
Observations from CD curves • For Re<1, we have creeping flow, and the drag coefficient decreaseswith increasing Reynolds number. For a sphere, it is CD=24/Re. There isno flow separation in this regime. • At about Re10, separation starts occurring on the rear of the body withvortex shedding starting at about Re 90. The region of separationincreases with increasing Reynolds number up to about Re 103. At thispoint, the drag is mostly (about 95 percent) due to pressure drag. The dragcoefficient continues to decrease with increasing Reynolds number in thisrange of 10<Re<103. • In the moderate range of 103<Re<105, the drag coefficient remainsrelatively constant. This behavior is characteristic of bluff bodies. Theflow in the boundary layer is laminar in this range, but the flow in theseparated region past the cylinder or sphere is highly turbulent with awide turbulent wake. • There is a sudden drop in the drag coefficient somewhere in the range of105<Re<106 (usually, at about 2105). This large reduction in CDisdue to the flow in the boundary layer becoming turbulent, which moves theseparation point further on the rear of the body, reducing the size of thewake and thus the magnitude of the pressure drag. This is in contrast tostreamlined bodies, which experience an increase in the drag coefficient(mostly due to friction drag) when the boundary layer becomes turbulent. • There is a “transitional” regime for 2105<Re<2106, in which CDdips to a minimum value and then slowly rises to its final turbulent value.
Flow separation occurs at about 80°(measured from the front stagnationpoint of a cylinder) when the boundary layer islaminar and at about 140° when it is turbulent. The delay of separation in turbulentflow is caused by the rapid fluctuations of the fluid in the transverse direction,which enables the turbulent boundary layer to travel farther along thesurface before separation occurs, resulting in a narrower wake and a smallerpressure drag. Flow visualization of flow over(a) a smooth sphere at Re = 15,000,and (b) a sphere at Re = 30,000 witha trip wire. The delay of boundarylayer separation is clearly seen bycomparing the two photographs.
Effect of Surface Roughness Surface roughness, in general, increases the drag coefficient in turbulent flow. This is especially the case for streamlined bodies. For blunt bodies such as a circular cylinder or sphere, however, an increase in the surface roughness may increase or decrease the drag coefficient depending on Reynolds number. The effect of surface roughness on thedrag coefficient of a sphere.
Drag force relation Frontal area for a cylinder and sphere Surface roughness may increase ordecrease the drag coefficient of aspherical object, depending on thevalue of the Reynolds number. Roughening the surface can be used togreat advantage in reducing drag. Golf balls are intentionally roughened toinduce turbulence at a lower Reynolds number to take advantage of the sharpdrop in the drag coefficient at the onset of turbulence in the boundary layer(the typical velocity range of golf balls is 15 to 150 m/s, and the Reynoldsnumber is less than 4105).The occurrence of turbulent flow at this Reynoldsnumber reduces the drag coefficient of a golf ball by about half. For a given hit, this means a longer distance for the ball. For a table tennis ball, however, the speeds areslower and the ball is smaller—it never reaches speeds in the turbulentrange. Therefore, the surfaces of table tennis balls are made smooth.
11–7 ■LIFT Lift: The component of the net force (due to viscousand pressure forces) that is perpendicular to the flow direction. A planform area: the area thatwould be seen by a person looking at the body from above in a directionnormal to the body Liftcoefficient For an aircraft,the wingspan is the total distance between the tips of thetwo wings, which includes the width of the fuselagebetween the wings. The average lift per unit planform area FL/Ais called the wingloading, which is simply the ratio of the weight of the aircraft to the planformarea of the wings (since lift equals the weight during flying at constantaltitude). Definition of various terms associatedwith an airfoil.
Airfoils are designed to generate lift while keeping thedrag at a minimum. Some devices such asthe spoilers and inverted airfoils on racing cars aredesigned for avoiding lift or generating negative lift to improve tractionand control. Lift in practice can betaken to be due entirely to the pressure distribution on the surfaces of thebody, and thus the shape of the body has the primary influence on lift. Thenthe primary consideration in the design of airfoils is minimizing the averagepressure at the upper surface while maximizing it at the lower surface. Pressure is low at locations where the flow velocity is high,and pressure is high at locations where the flow velocity is low. Lift atmoderate angles of attack is practically independent of the surfaceroughnesssince roughness affects the wall shear, not the pressure. For airfoils, the contribution ofviscous effects to lift is usuallynegligible since wall shear is parallelto the surfaces and thus nearly normalto the direction of lift.
Shortly after a sudden increase inangle of attack, a counterclockwisestarting vortex is shed from the airfoil,while clockwise circulation appearsaround the airfoil, causing lift tobe generated. Irrotational and actual flow pastsymmetrical and nonsymmetricaltwo-dimensional airfoils.
It is desirable for airfoils to generate the most lift while producing theleast drag. Therefore, a measure of performance for airfoils is the lift-to-dragratio, which is equivalent to the ratio of the lift-to-drag coefficientsCL/CD. The CL/CDratio increases with the angle ofattack until the airfoil stalls, and the value of the lift-to-drag ratio can be ofthe order of 100 for a two-dimensional airfoil. The variation of the lift-to-drag ratiowith angle of attack for a two-dimensionalairfoil.
One way to change the lift and drag characteristics of an airfoil is to change the angle of attack. On an airplane, the entire plane is pitched up to increase lift, since the wings are fixed relative to the fuselage. Another approach is to change the shape of the airfoil by the use of movable leading edge and trailing edge flaps. The flaps are used to alter the shape of the wings during takeoff and landing to maximize lift at low speeds. Once at cruising altitude, the flaps are retracted, and the wing is returned to its “normal” shape with minimal drag coefficient and adequate lift coefficient to minimize fuel consumption while cruising at a constant altitude. Note that even a small lift coefficient can generate a large lift force during normal operation because of the large cruising velocities of aircraft and the proportionality of lift to the square of flow velocity. The lift and drag characteristics of anairfoil during takeoff and landing canbe changed by changing the shape ofthe airfoil by the use of movable flaps.
Effect of flaps on the lift and dragcoefficients of an airfoil. The maximum lift coefficient increases from about 1.5for the airfoil with no flaps to 3.5 for the double-slotted flap case. The maximum drag coefficient increases from about 0.06 for the airfoilwith no flaps to about 0.3 for the double-slotted flap case. The angle of attack ofthe flaps can be increased to maximize the lift coefficient.
The minimum flight velocity can be determined from the requirement that the total weight W of the aircraft be equal to lift and CL=CL, max: For a given weight, the landing or takeoff speed can be minimized by maximizingthe product of the lift coefficient and the wing area, CL, maxA. One wayof doing that is to use flaps. Another way is to controlthe boundarylayer, which can be accomplished simply by leaving flow sections(slots)between the flaps. Slots are used toprevent the separation of the boundary layer from the upper surface of thewings and the flaps. This is done by allowing air to move from the high-pressureregion under the wing into the low-pressureregion at the top surface. A flapped airfoil with a slot to preventthe separation of the boundary layerfrom the upper surface and to increasethe lift coefficient.
CL increases almost linearly with the angle of attack,reaches amaximum at about =16°, and then starts to decrease sharply.This decrease of lift with furtherincrease in the angle of attack iscalledstall, and it is caused by flow separation and the formation of a wide wakeregion over the top surface of the airfoil. Stall is highly undesirable sinceit also increases drag. At zero angle of attack (= 0°), thelift coefficient is zero forsymmetrical airfoils but nonzero for nonsymmetrical ones with greatercurvature at the top surface.Therefore, planes with symmetrical wingsections must fly with theirwings at higher angles of attack in order toproduce the same lift. The variation of the lift coefficientwith the angle of attack for asymmetrical and a nonsymmetricalairfoil. The lift coefficient can be increased severalfold by adjusting the angleof attack (from 0.25 at =0° for the nonsymmetrical airfoil to 1.25 at=10°).