Download
1 / 1
10 likes | 86 Views
A Semi-Automatic Real-Time Three-Dimensional Digital Doppler Method for Measurement of Flow Volumes in Children: A Validation Using Cardiac Magnetic Resonant Imaging. Honghai Zhang 1 , Liping Bu 2 , Alan Stolpen 3 , Milan Sonka 1 , Shuping Ge 4

E N D
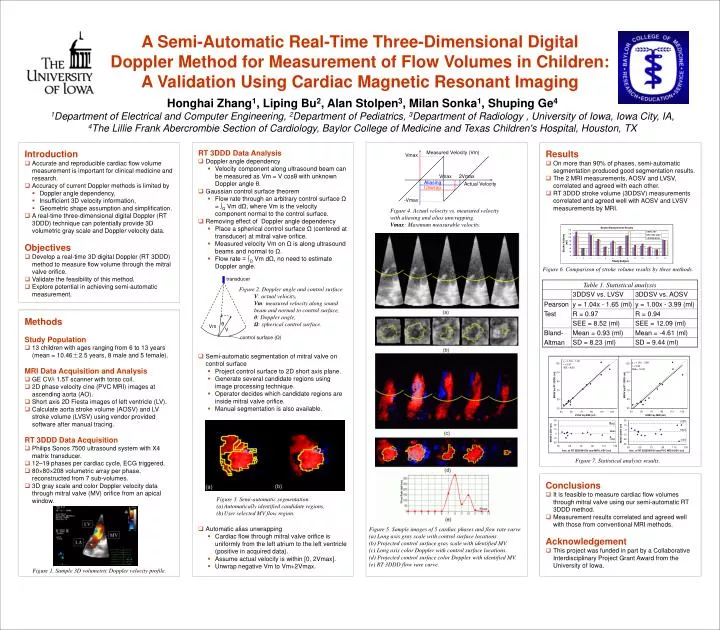
A Semi-Automatic Real-Time Three-Dimensional Digital Doppler Method for Measurement of Flow Volumes in Children: A Validation Using Cardiac Magnetic Resonant Imaging Honghai Zhang1, Liping Bu2, Alan Stolpen3, Milan Sonka1, Shuping Ge4 1Department of Electrical and Computer Engineering, 2Department of Pediatrics, 3Department of Radiology , University of Iowa, Iowa City, IA, 4The Lillie Frank Abercrombie Section of Cardiology, Baylor College of Medicine and Texas Children's Hospital, Houston, TX • Introduction • Accurate and reproducible cardiac flow volume measurement is important for clinical medicine and research. • Accuracy of current Doppler methods is limited by • Doppler angle dependency, • Insufficient 3D velocity information, • Geometric shape assumption and simplification. • A real-time three-dimensional digital Doppler (RT 3DDD) technique can potentially provide 3D volumetric gray scale and Doppler velocity data. Objectives • Develop a real-time 3D digital Doppler (RT 3DDD) method to measure flow volume through the mitral valve orifice. • Validate the feasibility of this method. • Explore potential in achieving semi-automatic measurement. RT 3DDD Data Analysis • Doppler angle dependency • Velocity component along ultrasound beam can be measured as Vm = V cosθ with unknown Doppler angle θ. • Gaussian control surface theorem • Flow rate through an arbitrary control surface Ω = ∫Ω Vm dΩ, where Vm is the velocity component normal to the control surface. • Removing effect of Doppler angle dependency • Place a spherical control surface Ω (centered at transducer) at mitral valve orifice. • Measured velocity Vm on Ω is along ultrasound beams and normal to Ω. • Flow rate = ∫Ω Vm dΩ, no need to estimate Doppler angle. • Semi-automatic segmentation of mitral valve on control surface • Project control surface to 2D short axis plane. • Generate several candidate regions using image processing technique. • Operator decides which candidate regions are inside mitral valve orifice. • Manual segmentation is also available. • Automatic alias unwrapping • Cardiac flow through mitral valve orifice is uniformly from the left atrium to the left ventricle (positive in acquired data). • Assume actual velocity is within [0, 2Vmax]. • Unwrap negative Vm to Vm+2Vmax. • Results • On more than 90% of phases, semi-automatic segmentation produced good segmentation results. • The 2 MRI measurements, AOSV and LVSV, correlated and agreed with each other. • RT 3DDD stroke volume (3DDSV) measurements correlated and agreed well with AOSV and LVSV measurements by MRI. Measured Velocity (Vm) Vmax Vmax 2Vmax Aliasing Actual Velocity Unwrap -Vmax Figure 4. Actual velocity vs. measured velocity with aliasing and alias unwrapping. Vmax: Maximum measurable velocity. Figure 6. Comparison of stroke volume results by three methods. transducer • Figure 2. Doppler angle and control surface • V: actual velocity, • Vm: measured velocity along sound beam and normal to control surface, • θ: Doppler angle, • Ω: spherical control surface. Methods Study Population • 13 children with ages ranging from 6 to 13 years (mean = 10.46±2.5 years, 8 male and 5 female). MRI Data Acquisition and Analysis • GE CV/i 1.5T scanner with torso coil. • 2D phase velocity cine (PVC MRI) images at ascending aorta (AO). • Short axis 2D Fiesta images of left ventricle (LV). • Calculate aorta stroke volume (AOSV) and LV stroke volume (LVSV) using vendor provided software after manual tracing. RT 3DDD Data Acquisition • Philips Sonos 7500 ultrasound system with X4 matrix transducer. • 12–19 phases per cardiac cycle, ECG triggered. • 80×80×208 volumetric array per phase, reconstructed from 7 sub-volumes. • 3D gray scale and color Doppler velocity data through mitral valve (MV) orifice from an apical window. θ Vm V control surface (Ω) Figure 7. Statistical analysis results. • Conclusions • It is feasible to measure cardiac flow volumes through mitral valve using our semi-automatic RT 3DDD method. • Measurement results correlated and agreed well with those from conventional MRI methods. • Acknowledgement • This project was funded in part by a Collaborative Interdisciplinary Project Grant Award from the University of Iowa. • Figure 3. Semi-automatic segmentation: • Automatically identified candidate regions, • User selected MV flow region. Figure 5. Sample images of 5 cardiac phases and flow rate curve (a) Long axis gray scale with control surface locations. (b) Projected control surface gray scale with identified MV. (c) Long axis color Doppler with control surface locations. (d) Projected control surface color Doppler with identified MV. (e) RT 3DDD flow rare curve. Figure 1. Sample 3D volumetric Doppler velocity profile.