Download
1 / 13
140 likes | 327 Views
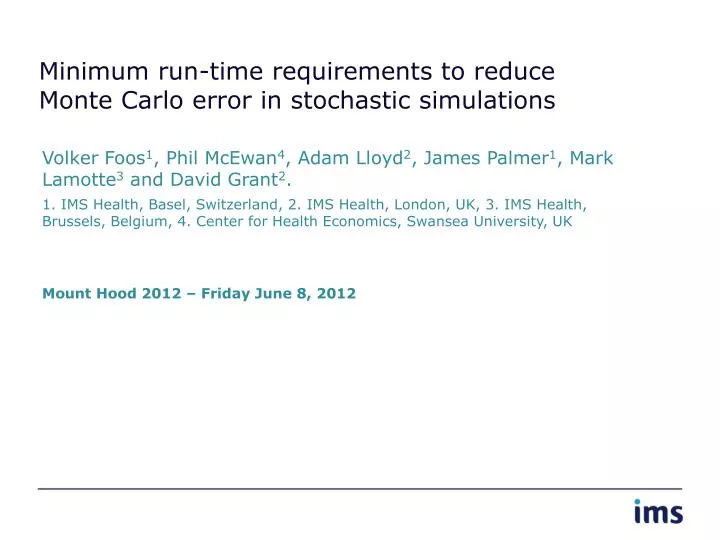
Minimum run-time requirements to reduce Monte Carlo error in stochastic simulations. Volker Foos 1 , Phil McEwan 4 , Adam Lloyd 2 , James Palmer 1 , Mark Lamotte 3 and David Grant 2 .

E N D
Minimum run-time requirements to reduce Monte Carlo error in stochastic simulations Volker Foos1, Phil McEwan4, Adam Lloyd2, James Palmer1, Mark Lamotte3 and David Grant2. 1. IMS Health, Basel, Switzerland, 2. IMS Health, London, UK, 3. IMS Health, Brussels, Belgium, 4. Center for Health Economics, Swansea University, UK Mount Hood 2012 – Friday June 8, 2012
The key consideration of PSA is to assess outcome variability that can be attributed to parameter uncertainty In HEOR the role of probabilistic sensitivity analysis (PSA) is to propagate the uncertainty of model predictions with respect to the underlying parameter uncertainty. However, in Monte Carlo simulation parameter uncertainty coincides with and cannot be distinguished from stochastic uncertainty (1st order variability/random noise/Monte Carlo error [MCE]). The minimum criteria for PSA runs should be therefore to reduce 1st order variability to such an extent that a meaningful assessment of parameter uncertainty is possible. In Monte Carlo simulation, MCE can be reduced by increasing the number of patients that are processed through the model. Background
The overall objective was to demonstrate the relation of 1st and 2nd order variability for different degrees of parameter uncertainty The overall objective of our investigation was to demonstrate the relation of 1st and 2nd order output variability for Increasing number of patients - to identify the number of patients required to allow a meaningful assessment of parameter uncertainty while keeping within reasonable levels of computation time). Two different degrees by which input model parameters were sampled using Standard deviations (SD) representing a larger input parameter variability Standard errors (SE) representing lower input parameter variability Objective
We used a well established and validated diabetes simulation model to illustrate the degree of MCE vs. parameter uncertainty The IMS CORE diabetes model (CDM), was used to compare the outcome variability for bootstrap simulations with 1,000 repetitions for patient cohorts ranging from 500 to 100,000. Model projections were obtained evaluating the cost effectiveness of two hypothetical interventions with differences in clinical effectiveness of 0.5% HbA1c and a 2kg weight change in favor of the treatment- vs. control arm and a 400 Euro difference in treatment costs. Each simulation was performed in three ways no parameter sampling parameters were sampled around 5% of their means (intending to represent variability for SE input) parameters were sampled around 25% of their means (intending to represent variability for SD input) Materials and Methods
The degree of randomness contained in PSA confidence ranges can be assessed by comparing confidence ranges of sampled vs. non sampled analyses Output variability was classified as 1st or 2nd order and the amount of MCE assessed by comparing confidence ranges of selected endpoints in sampling vs. non sampling analyses The variability of outputs that is attributed to parameter sampling can be assessed by comparing confidence sizes of 1st order simulations vs. 2nd order simulations. Materials and Methods • While stochastic models don’t specifically behave in this predictive way our intention was to estimate the run time (number of patients) required to start making predictive assumptions on the parameter uncertainty in the hypothetical absence of 1st order variability.
The last assessment can be illustrated as follows… While confidence ranges decline with increasing number of patients (thereby reducing MCE), the proportion of the confidence range that is attributable to parameter uncertainty remains stable. Therefore the number of patient required to reduce 1st order variability below overall outcome variability has to be identified. Depending on the selected endpoint, this assessment may be straight forward or not. Materials and Methods
We selected two different criteria to determine minimum run time requirements When stochastic uncertainty (CI of non PSA analysis) consistently decreased below overall outcome variability (CI of PSA analyses) When stochastic uncertainty (CI of non PSA analysis) decreased below 50% of overall outcome variability (CI of PSA analyses) We focused on confidence ranges of the ICER per QALE gained The overall criteria was that the prediction of stochastic uncertainty was reliable so the confidence range in non PSA runs decreased with increasing number of patients. Materials and Methods
Based on the 1st criteria, analyses of the confidence ranges suggested a minimum number of 10,000 patients required to run over 1000 bootstrap repetitions Results • Confidence ranges in non PSA runs demonstrated an irregular pattern (increased or maintained stable) with increasing patient number until 10,000 included patients. • A clearer picture could have been obtained by increasing the number of bootstrap repetitions • Beyond 10,000 included patients, both confidence ranges for SE and SD based PSA were consistently lower vs. those obtained in non PSA
When minimum run time requirements were defined according to the 50% threshold of stochastic uncertainty contained in overall uncertainty the number of required patient runs increased Results • The proportion of stochastic uncertainty contained in overall ICER variability was obtained from the ratio of confidence sizes of the no PSA vs. PSA runs. • Run time requirements For PSA based on SE input remained at 10,000 included patients. • When SE inputs were used in PSA the minimum run time requirement increased to 50,000 patients • The question remains which part of the overall uncertainty is attributable to 1st order and 2nd order.
A theoretical exercise was conducted to to evaluate the implications two overlaying distributions (random noise and parameter uncertainty) on the joint distribution • 10000 random draws were generrated in MS Excel with: • A) mean = 50 +/- 5 • B) mean = 0 +/- 10 to 0.5 • C) Joint distributio was calculated as A+B • The SD of the joint distributio was compared to SD‘s of distribution B to assess % overestimation
The proportion of the confidence range attributable to parameter uncertainty was estimated from the relationship between 1st and 2nd order outcome variability obtained from this theoretical exercise For SE based PSA the proportion of parameter uncertainty from overall uncertainty was 88.9% (x confidence width) For SD based PSA the proportion was 93.3%
Run time requirements to reduce Monte Carlo error are lower whenever the uncertainty of included parameters is increased In an ideal world, an infinitely high number of patients should be applied in stochastic models to reduce random noise to zero so parameter uncertainty can be precisely assessed. We have shown that even if stochastic uncertainty is not fully eliminated it is possible to predict the expected degree of parameter uncertainty. For this, run time has to be increased to the level that allows a reliable interpretation of confidence ranges. The higher the underlying parameter uncertainty, the lower are the requirements to reduce 1st stochastic uncertainty in order to assess parameter uncertainty In the CORE Diabetes Model, 10,000 and 50,000 patients were required in bootstrap simulations of 1000 repetitive runs to make reliable assumptions on parameter uncertainty when SD and SE were used to represent parameter uncertainty Conclusion Foos et al, ADA Philadelphia, 9 June 2012
Thank You! Foos et al, ADA Philadelphia, 9 June 2012