Download
1 / 49
550 likes | 747 Views
Prevalence and Risk Factors for Postpartum Anovulation in Dairy Cows. Robert Walsh November 30, 2006. Outline. Resumption of Ovarian Activity Identification of at Risk cows Cow-level risk factors Herd-level risk factors Questions. Outline. Resumption of Ovarian Activity.

E N D
Prevalence and Risk Factors for Postpartum Anovulation in Dairy Cows Robert Walsh November 30, 2006
Outline • Resumption of Ovarian Activity • Identification of at Risk cows • Cow-level risk factors • Herd-level risk factors • Questions
Outline • Resumption of Ovarian Activity
Resumption of Ovarian Activity Follicle diameter (mm) 16 14 12 10 8 6 4 2 0 All follicles present at birth Follicle development divided into 3 stages Stage Size Duration Recruitment < 0.13mm birth - Slow phase 0.16 – 3 mm 10 – 40 days Fast phase > 4 mm 8 - 10 days (Lussier et al. 1987) 0 5 10 15 20 25 30 35 Calving Ovulation DIM
Resumption of Ovarian Activity Follicle diameter (mm) 16 14 12 10 8 6 4 2 0 Atresia or ovulation IGF-1, IGFBP, E2, …. Deviation Luteinizing Hormone (LH) Emergence Follicle Stimulating Hormone (FSH) 0 5 10 15 20 25 30 35 Calving Ovulation DIM
Resumption of Ovarian Activity Follicle diameter (mm) 16 14 12 10 8 6 4 2 0 33.8 days(1106 Lactations; Petersson et al. 2005) 27.4 days(>1200 Records; Royal et al. 2004) 28.7 ± 14.6 days(2503 Lactations, Lamming and Darwash 1998) 29 days Control line vs. 43 days Select(Lucy et al. 2001) 43 days First Estrus(1398 Lactations, Thatcher and Wilcox, 1973) 0 5 10 15 20 25 30 35 Calving Ovulation DIM
Resumption of Ovarian Activity Reference Location DIM DOV1 ALL Lopez et al. 2004 Wisconsin 70 28.5% Cerri et al. 2004 California 65 25.7% Moreira et al. 2001 Florida 63 23% Opsomer et al. 2000 Belgium 50 21.2% 49% Lamming and Darwash 1998 England 10.9% 38% Shrestha et al. 2004 Japan 24.1% 57% Archbald et al. 1990 Florida 30 30% McDougal and Compton 2005 NZ 20.9% Thatcher and Wilcox 1973 Florida 60 25.9% (Estrus)
Anovulation Follicle diameter (mm) 16 14 12 10 8 6 4 2 0 Follicular Growth to Deviation Consecutive waves of follicle growth initiated by FSH Insufficient LH to support deviation Communication failure between ovary and hypothalamus 5 10 15 20 25 Days In Milk (Wiltbank et al. 2002)
Anovulation Follicle diameter (mm) 16 14 12 10 8 6 4 2 0 Follicles Larger than Ovulatory Size LH release supports deviation Elevated E2 concentration Failure of ovulation The presence of large follicles does not preclude Normal ovarian activity and function 5 10 15 20 25 Days In Milk (Wiltbank et al. 2002)
Outline • Resumption of Ovarian Activity • Identification of at Risk cows
Objectives • Determine prevalence of anovulation • Assess consequences of anovulation • Identify cow-level risk factors • herd-level risk factors
Observational Protocol BCS Record peripartum disease HH visit BCS, Lameness 0 4 11 38 52 60 Milk P4 Milk Ketotest™ Anestrus Both samples <1ng/ml Calving Collect Reproduction and Culling Data Data presented from 1341 cows
Descriptive Data TiestallFreestall HerdsCows Herds Cows Herd Size < 100 cows 9 404 3 178 > 100 cows 1 65 5 694 Milk Frequency 2 Times/day 9 404 4 218 3 Times/day 1 65 4 654 TAI First Service > 90 % 5 236 1 61 0 to 50% 5 233 7 775 Rumensin CRC 2 82 2 427 Premix 6 292 3 308 Both 2 95 3 137
Study Population • Enrolled 20 herds (lost 2) • Total calving 2645 • Culled prior to 52 DIM 277 • Total eligible 2368 • Two Milk Samples1 1575 • Met Inclusion criteria 1341 (56.7%) • Herd specific inclusion ranged 33 – 90% • Disease under-reported in cows not sampled • No significant difference in parity distribution, first milk projection, days dry between included and excluded cows • Excluded cows more likely culled(P < 0.001) 1 Excluded if milk sample protocol violated or use of hormones
Cow Level Prevalence of Anovulation 19.5% (95% CI 17.4 – 21.7%)
Impact of Anovulation • 1 in 5 cows • Herd Repro Management • Heat Detection • Timed Insemination protocols VWP 45-60 d No Estrus Activity Ovarian Activity ?? Calving
Herd Repro Program Factor AIHR P 95% CI Heat Anovular 80b 0.7 <0.0001 0.6 to 0.8 Detection1 Cycling 72a Referent Timed Anovular 78ab 0.67 0.19 0.1 to 1.2 AI2 Cycling 76b Referent Multiparous 0.84 0.04 0.7 to 0.9 Retained Placenta 0.75 <0.001 0.6 to 0.8 1 Insemination at Observed Estrus in >50% of herd (12 herds 79% of cows) 2 Timed Insemination in > 90% of herd (6 herds, 21% of cows) Time to First Insemination
Herd Repro Program Factor FSCROR P 95% CI Heat Anovular 20.3b 0.6 0.007 0.4 to 0.6 Detection1 Cycling 30.5a Referent Timed Anovular 29.7ab 0.67 0.19 0.1 to 1.2 AI2 Cycling 35.9a Referent Multiparous 0.73 0.02 0.6 to 0.9 1 Insemination at Observed Estrus in >50% of herd (12 herds 79% of cows) 2 Timed Insemination in > 90% of herd (6 herds, 21% of cows) Probability of Pregnancy after First Insemination
Time to Pregnancy 156 126 • Time Adjusted HR • 81 0.56 • 123 0.74 • 165 0.89 • Adjusted HR = HR*TVCln(t)
Diagnosis of Anovulation • Rectal Palpation1(2 palpations 14-days apart) • Sensitivity 65.4% • Specificity 68.6% • Positive Predictive value 31.9% 1 gold standard circulating progesterone
Diagnosis of Anovulation using Pedometry (HDR ~ 60%) • Sensitivity 83.0% • Specificity 68.0% • Positive Predictive value 34.0%
Diagnosis of Anovulation Assumption 100 cows, True Prevalence of 20% 1 Walsh et al. (Unpublished) 2 Sprecher et al. 1989; Theriogenology 3 McDougal and Rhodes, 1999; NZVJ (Apparently Anestrus cows) 4 Core et al. (Unpublished)
Outline • Resumption of Ovarian Activity • Identification of at Risk cows • Cow-level risk factors
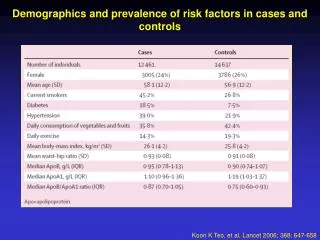
Univariable Risk Factor Analysis Controlling for fresh season (* P < 0.05; ** P < 0.01; *** P < 0.001)
Final Risk Factor Model (* P < 0.05; ** P < 0.01; *** P < 0.001)
Prevalence of anovulation by Parity Parity is an inconsistent risk factor for anovulation
Lameness • 238 Animals, 11% DOV • Lameness(Median day of diagnosis = 15 DIM) • 42% Moderately Lame • 17% Lame • Relative to animals never classified as lame controlling for calving season, lactation, ketotsis*and Milk Production (305ME)* • Moderate Lameness 2.14 odds of DOV (95%CI = 0.7 , 6.14) • Lame 3.5 increased odds of DOV (95% CI = 1.0 , 12.7) Milk P4 Calving Lameness Score (1-5) Garbarino et al. 2004
Lameness and Reproductive Performance • 65 Cases, 130 Controls • Controlling for parity, calving season, and milk yeild (305ME) • Non-lame cows 4.22 times more likely to conceive at first service (95% CI 1.59 , 11.2) • Lame cows 2.63 times more likely to have an occurrence of an ovarian cyst • Using Survival analysis • Lame cows HR 0.43 (95% CI 0.28 , 0.66) Melendez et al. 2003
Body condition Loss • Lopez-Gatius et al. Theriogenology 2003 • 4529 cows from 11 studies • Relative to BCS 2.5-3.5 • <2.5 at parturition + 6 DOPN • >3.5 at parturition – 6 DOPN • Relative to BCS change <0.5 units between parturition and first AI • Loss >1 +10.6 DOPN • Not significant in all studies • Ruegg et al. 1995 • Domecq et al. 1999
Milk Production Study Milk Measure Delayed Ovulation Opsomer et al. 2000 100d & 305d FCM ns Shrestha et al. 2004 305d FCM ns Santos et al. 2004 Proj 305 ME 0.21(0.05 to 0.98) high vs. Med Time to Pregnancy Gröhn and Rajala-Schultz 2000 60d Milk HR 0.92 (highest vs. lowest)
Outline • Resumption of Ovarian Activity • Identification of at Risk cows • Cow-level risk factors
Cow Level Prevalence of Subclinical Ketosis Week 126.2% (95% CI 23.5 to 28.9 %)
Energy Balance and DOV • 54 Multiparous HF cows calculated energy balance Item ER LR NR Number 25 (46%) 14 (26%) 15 (28%) 4% FCM (kg/d) 33.4 31.7 28.5 DMI (kg/d) 18.8 17.7 15.2 Day to Ovulation 21.9 43.1 Days Open 133 88 200 Calving7 14 21 28 35 42 49 56 63 Progesterone Profile ER LR NR Staples et al. 1990
Estimating Energy Status • Significant correlation between ketone body concentration and CLA (Reist et al. 2000) • Milk Acetone week 3-6 not associated with FSCR (Plym-Forshell, 1991) • Increased DOPN, Increased culling risk (Cook et al. 2000) • 1400 mol/ml HBA cutpoint used for disease status
Impact of subclinical ketosis on the probability of pregnancy at first service and time to pregnancy Objectives • Is SCK early in lactation associated with the probability of pregnancy at first insemination? • Which week postpartum has the most impact? • Does the duration of SCK impact probability of pregnancy at first insemination or time to pregnancy?
Impact of subclinical ketosis on the probability of pregnancy at first service and time to pregnancy BCS BCS Observe for estrus and breed -3 0 1 2 3 6 9 • 25 Herds (25-160 cows) • 1010 cows • Exclusion criteria • 806 records for analysis • Rumensin CRC study 1995-1996 (Duffield et al. 1999) Calving PD Serum Sample Store samples and analyze for HBA
Distribution of serum BHBA 16% week 1 (132/806 cows) 19% Week 2 (152/806 cows)
Mean Serum BHBA Sorted by Pregnancy Diagnosis to First Insemination
Impact of Subclinical Ketosis in the Second Week Postpartum on the Probability of Pregnancy at First Insemination .4 .3 Probability of Pregnancy .2 .1 0 0 2000 4000 6000 8000 Week 2 serum BHBA concentration (mmol/L)
Effect of Prolonged Elevation of Serum BHBA on the Probability of Pregnancy at First Insemination OR = 0.83 P = 0.2 OR = 0.47 P = 0.003 Probability of Pregnancy (%) Number of Weeks Above BHBA Cutpoint
Impact of duration of subclinical ketosis on time to pregnancy Median time to Pregnancy 108 124 130 1.00 Not Ketotic 0.75 Ketotic week 1 or week 2 Survival Function (Proportion Not Pregnant) Ketotic both week 1 and 2 0.50 0.25 0.00 0 100 200 300 400 Days in Milk Time Adjusted HR 81 0.62 0.63 123 0.75 0.84 165 0.85 1.02 Adjusted HR = HR*TVCln(t)
Cow-level Summary • Diagnosis is problematic • Calving history / periparturient disease • Subclinical ketosis
Dry Period Length • >77days vs. <63 days 2.9 times more likely to experience DOV(Opsomer et al. 2000) • DD associated with increase risk of longer DOPN (Moss et al. 2002) (Gümen et al. 2005)
Milking Frequency • 3X vs 2X majority of studies show no difference (Weiss et al. 2004; Barnes et al. 1990; Amos et al. 1985*) • 3X vs 2X associated with 6d increase DOPN (Smith et al. 2002) • 3X vs. 6X for 3 weeks increased DOPN (Bar-Peled et al. 1995)
Herd-Season Anovulation Prevalence • 34 herd-seasons from 18 herds (Fall vs. Other) • Linear regression of herd-level prevalence • Relative to Tie-Stall barns the prevalence of anestrus • ↓ 7.2% in 3-Row Freestalls (P = 0.1) • ↓ 11.0 % in 2-Row Freestalls (P = 0.007) • ↑ 2.1% for every 10% ↑in herd-season prevalence of SCK
Herd-Season Anovulation Prevalence • Things to Consider • Stocking density • Number of ration or group changes • Dry period length
Acknowledgement Advisors Drs. Leblanc, Leslie, Duffield, Kelton and Walton Veterinarians Almonte, Bay of Quinte Veterinary Services, Embrun, Ferguson, Grenville-Dundas, Kirkton, Linwood, Listowel, Navan, New Hamburg, Tavistock AABP Research Assistantship