Download
1 / 5
320 likes | 1.31k Views
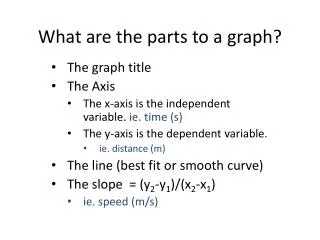
X- Axis = Independent variable If time is present, it is usually ALWAYS goes on the x-axis (independent variable) Y- Axis = Dependent variable. T.A.I.L.S for graphs. T = Title is present A = Correctly label x/y - axes (with label & units)

E N D
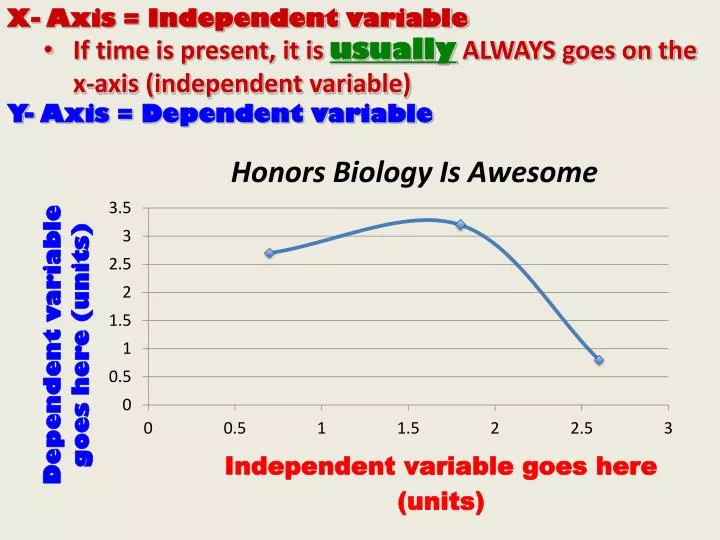
X- Axis = Independent variable • If time is present, it is usually ALWAYS goes on the x-axis (independent variable) • Y- Axis = Dependent variable
T.A.I.L.S for graphs • T = Title is present • A = Correctly label x/y-axes (with label & units) • I = Use consistent intervals on axes-space intervals evenly (intervals do not need to be the same on each axis) • L = Label a key (if applicable) • S = Size (BIG graphs/use entire graph paper)
Line graph vs. Bar graph • When the independent variable has: • only certain fixed values, use a bar-graph. • A continuous range of values, use a line-graph.
Example: • Number of birds chirping in the morning during the different temperatures of the year.
Bar graph example: • Number of Lane tech students in each grade: