Download
1 / 33
340 likes | 495 Views
Multispectral and Hyperspectral Imaging for Land Cover and Habitat Mapping. Using spectral data to discriminate land cover types. To review …. Vegetation All of the plant life in a particular region ( e.g ., the vegetation of Wyoming) or period ( e.g ., Pleistocene vegetation)

E N D
Multispectral and Hyperspectral Imaging for Land Cover and Habitat Mapping Using spectral data to discriminate land cover types
To review… • Vegetation • All of the plant life in a particular region (e.g., the vegetation of Wyoming) or period (e.g., Pleistocene vegetation) • Examples: Lodgepole pine forest; sagebrush steppe; mixed grass prairie • Land Cover • Everything that occupies the land surface including human disturbance and unvegetated (barren) areas • Examples: Lodgepole pine forest, urban, unvegetated sand dunes • Habitat • The area that an organism occupies and the type of environment an organism or population of organisms need to survive. • Examples: Lodgepole pine forest; sagebrush within 5 km of water
Vegetation – lodgepole pine trees + understory species together comprise a type of vegetation Sagebrush and associated plants are another
Land cover includes vegetation or bare dunes or other surface types
Habitat – can require particular spatial arrangement of patches
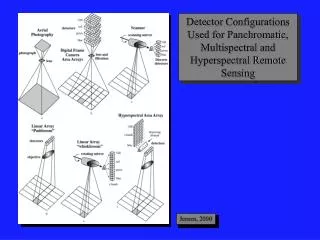
Air Photos vs. Multi/Hyperspectral Mapping • General procedures are the same (see air photo lecture) • Satellite based mapping is usually digital, but can be manual like with air photos • Satellite mapping usually relies more on spectral information than does mapping from aerial photos • Satellite based mapping is often for larger areas than aerial photo mapping and at coarser spatial resolution
Other advantages of satellite data for land cover mapping • Large area coverage • Frequent and regular return times • Radiometric and geometric consistency • Higher spectral resolution • Many custom digital tools available for analysis
Satellite Mapping Disadvantages/Challenges • Resolution trade-offs (e.g., lower spatial resolution) though this is changing • Spectral confusion sometimes does not allow us to distinguish cover types that users need to map • Return time sometimes too slow (Landsat 16 days) • Sensor failures out of our control • Less control over mission parameters
Spectral Confusion Spectral confusion in overlap zone even though peaks are distinct. Sometimes there is LOTS of overlap
So how do we map different classes of vegetation, land cover, and habitat using satellites? • The biggest advantage of satellite data is the spectral information they contain • To distinguish cover types with satellites they must be spectrally different from one another • If cover types are spectrally ambiguous (spectral confusion), we must include other data to accurately distinguish them (e.g., environmental data)
The classification problem: • How does one group image pixels into predetermined thematic classes when they may or may not be spectrally distinct from other thematic classes? • Requires thoughtful choice of classes • Requires knowledge of the spectral properties of classes including spectral variability • Requires knowledge of sensor characteristics • Requires knowledge of spatial-environmental relationships of types • Requires a great deal of patience to sort out all of the above and apply the knowledge logically
Image classification questions • What factors (e.g., reflectance, environmental relationships, context, history, etc.) make one feature of interest different from another? • Can you capture the differences accurately with obtainable spatially distributed data? • How can you best exploit the differences between features statistically or otherwise?
What is Image Classification? • Image classification includes all of the steps necessary to group pixels into thematic classes – self similar groups representing some common feature • Classification tries to use all necessary and available information to distinguish classes • Note that “image classification” is the process of making a map. A “classification scheme” is a list of types in the map legend.
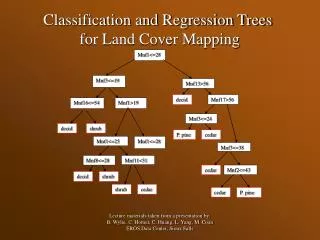
Per pixel classification of digital imagery • Digitally creating groups of pixels that (hopefully) correspond to similar cover types on the ground • Two main strategies: • Unsupervised classification – group pixels using the pixel values to determine natural spectral groups in the data • Supervised classification – group unknown pixels with pixels representing known types from the ground by measuring their similarity to the known pixels.
Classification Use many bands simultaneously (multivariate) to create a map of classes
First satellite based statewide mapping in Wyoming • Early map by Fred Porter and others at the Wyoming State Geological Survey • Based on MSS data • Product was a paper map of the state • Course resolution of types • Availability?
Gap Analysis Land Cover • Statewide coverage • Completed in early 1990s using 1989 imagery • Hand digitized from Landsat TM images • Coarse MMU (1 km2) • More detailed list of cover types (41) than earlier statewide map • Digital data still available (WyGISC) and still used, though recently replaced with a new regional Gap Analysis
Wyoming Maps in National Programs • National Land Cover Database (NLCD 2001 and 2006 complete) • Landfire(completed 2001, revised 2010, and updated regularly) • Gap Analysis (ReGap). Complete for Wyoming as part of the Northwest Regional Gap Analysis.
NLCD 2001 Data (updated 2006) All of Wyoming Broad cover types
Landfire (2006) for Wyoming Covers entire U.S.
Wyoming Mapping in State Agencies • Recent mapping projects with goal of improving resolution of statewide map products • Spatial resolution generally at full TM/ETM+ resolution (30 m pixels) but sometimes aggregated to slightly larger MMUs (2 acre) • Resolution of cover types with more detail than GAP and other programs • Local field input to improve accuracy
Primary Players • Wyoming Game and Fish Dept. • Wyoming State BLM Office • U.S. Forest Service (National Forests only) • WyGISC • Other agencies and private contractors
Wyoming Challenges • Biggest challenge in Wyoming is matching what we can do over large areas with satellites to what is needed by land managers on the ground • Resolution mismatches • Spectral confusion • Accuracy problems • Land managers also need land cover structural information (cover density, height of vegetation, etc.) • Habitat managers need to integrate temporal differences in habitat – e.g., crucial winter range vs. summer range, etc.
Addressing challenges • Combining spectral mapping with environmental modeling can help us solve spectral confusion • Future challenge will be to understand the influence of history on the distribution of land cover.