Download

1 / 35
350 likes | 357 Views
Satellite Imagery for Agronomic Management Decisions. Winter Wheat, Pond Creek in North Central Oklahoma April 23, 1998. Variability ???. April 23,1998 TM Scene over North Central Oklahoma. Image Processing and NDVI Computation

E N D
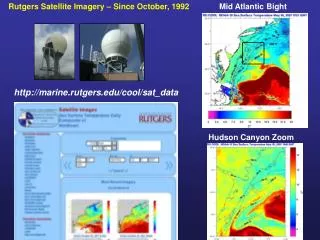
Winter Wheat, Pond Creek in North Central Oklahoma April 23, 1998 Variability???
ImageProcessing and NDVI Computation Clear-sky Thematic Mapper (TM) scenes of north-central Oklahoma, spanning the period 1991 to 1999, were obtained from Space Imaging with radiometric and geometric corrections. The TM scenes were chosen so that the satellite overpasses occurred at or near the heading stage of winter wheat in the area (mid April to early May).
April 4, 1991 May 9, 1992 April 25, 1993 March 27, 1994 April 2, 1996 April 20, 1997 April 23, 1998 May 12, 1999 Dates and TM scenes used in the study:
OSU Wheat Pasture Research Unit Overlaid on top of April 23,1998 False Color TM Image (Green, Red, and NIR bands). N Grain wheat Grazed out wheat
OSU Wheat Pasture Research Unit with NDVI from April 23,1998 TM Image7
Calibration curve of wheat grain yield as a function of Landsat TM NDVI. Oklahoma State University Wheat Pasture Research Unit, Marshall, OK.
Relative Locations of Test Farms and OSU Wheat Pasture Research Unit Cherokee Pond Creek OSU WPRU Marshall
Field-average wheat grain yield, as predicted from NDVI and measured by farmer cooperators.
Field-average wheat yield as a function of field-average NDVI, compared with the OSU WPRU prediction equation.
Yield Monitor 26.4 bu/ac Satellite Estimate 28.7 bu/ac Combine Yield Monitor and Satellite Estimated Wheat Yield Maps
Normalizing Satellite Estimated Yield • Normalization tends to remove the effect of weather, disease and other factors on the average yield. • This minimizes the effect of abnormally high or yields when yield variability is compared between years or averaged over years. • Yields can be normalized by dividing by the average yield for the field.
1992 1996 1998 Wheat - Landsat TM Image Taken During April to Mid-May Linn Farm, Redrock, OK
Aerial Image vs. Average Yields Linn Aerial Image Terrace Effects
NorgeC2 KirklandB2 PortA NorgeB KirklandB Misclassified Linn Farm 7 Year Average Estimated Yield and Coefficient of Variation Floods
Wheat - Landsat TM Image Taken During April to Mid-May Kent Farm, Pond Creek, Ok 1996 1998
Pond Creek, Oklahoma Dale Silt Loam McLain Silt Loam Owner Identified Soil
Kent 160, Pond Creek, OK, Normalized Estimated Yield and Temporal Coefficient of Variation for Seven Years of Data Water and Hay for Calves Field Drainage
Cherokee, Oklahoma Reinach Very Fine Sandy Loam McLain Silt Loam Dale Silt Loam - SALINE
Cherokee, Oklahoma Drainage problem from moldboard dead furrow Hayed for Demonstration Plots Salt Slick
Average Normalized Yield • < 0.85 • 0.85 – 0.95 • 0.65 – 1.05 • 1.05 – 1.15 • 1.15 • Field Boundary Hitchcock, OK
Hitchcock, OK Farm since homesteaded Average Normalized Yield • < 0.85 • 0.85 – 0.95 • 0.65 – 1.05 • 1.05 – 1.15 • 1.15 • Field Boundary Broken out of native grass pasture in 10 ac increments in the 1970’s
Disease Effect on Estimated Yield -Enid, OK 5% Set-Aside Ground 2180 Chisholm
Carrier, OK – 1999 Yield Hail Damage
Tonkawa, OK Sprayed with Metribuzin for Cheat Not sprayed for cheat Area was intensively grazed by 105 calves. Wheat yield was about 3 times greater than estimated Saline Soil
What may be gained by even higher resolution sensing? 25 m Resolution (Re-sampled) Landsat TM 1m Resolution NDVI
Conclusions • Satellite imagery can be used to predict yields. • Normalized estimated yield can be used for management decisions: • Define average relative yield • Identify regions of high and low yield whose cause changes slowly over time • Drainage • Soil type • Organic matter • pH
Conclusions • Images can be used to define management zones for the purpose of managing these variables. • Imagery can complement yield monitor data or when yield data are not available can serve as a surrogate. • Currently, Landsat TM images are the only source of historical data for the entire United States, and, despite the coarse resolution provides, a means to begin managing less than field size areas.
30 by 30 m Sensing and Treatment Resolution 1 m by 1 m