Download
1 / 6
60 likes | 71 Views
A simple, accurate and precise spectroscopic method was developed for simultaneous estimation of amlodipine and nebivolol (in pure and in their pharmaceutical dosage form). The method involves solving of simulta- neous equations based on measurement of absorbances at two wavelengths 242.0nm and 286.8nm which are the wavelength maxima of amlodipine and nebivolol, respectively. The method was successfully applied for si- multaneous determination of amlodipine and nebivolol in binary mixture.

E N D
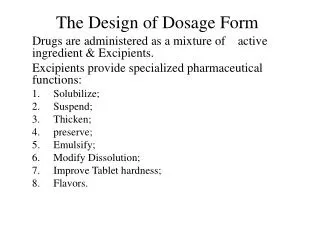
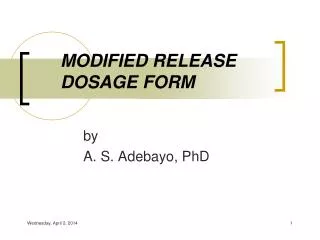
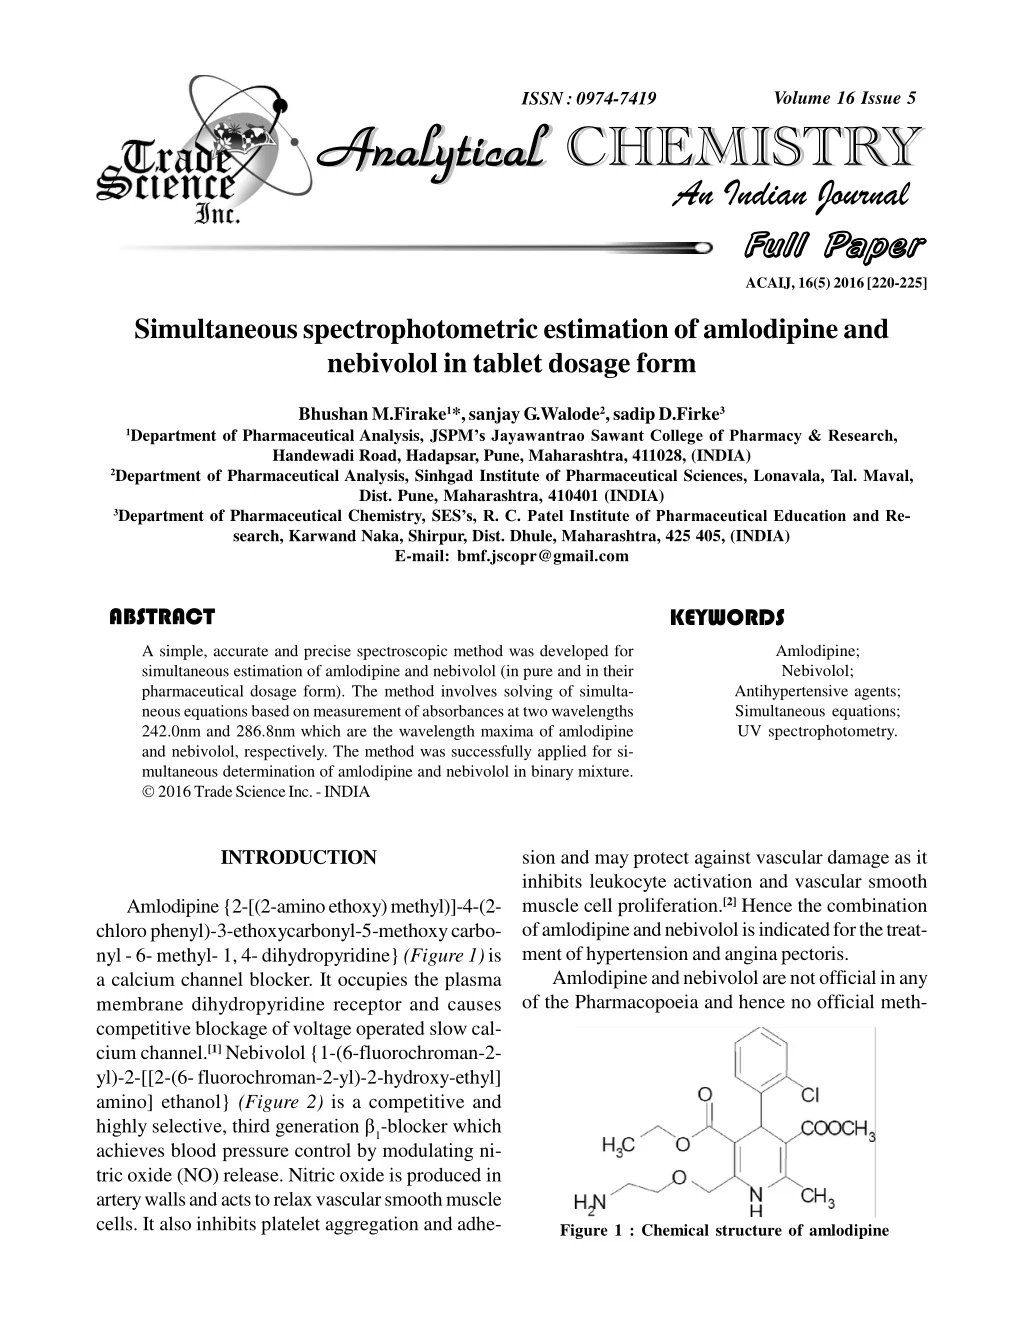
id4370953 pdfMachine by Broadgun Software - a great PDF writer! - a great PDF creator! - http://www.pdfmachine.com http://www.broadgun.com Volume 16 Issue 5 ISSN : 0974-7419 Analytical Analytical CHEMISTRY Analytical Analytical CHEMISTRY An Indian Journal Full Paper Full Paper ACAIJ, 16(5) 2016 [220-225] Simultaneous spectrophotometric estimation of amlodipine and nebivolol in tablet dosage form Bhushan M.Firake1*, sanjay G.Walode2, sadip D.Firke3 1Department of Pharmaceutical Analysis, JSPM’s Jayawantrao Sawant College of Pharmacy & Research, Handewadi Road, Hadapsar, Pune, Maharashtra, 411028, (INDIA) 2Department of Pharmaceutical Analysis, Sinhgad Institute of Pharmaceutical Sciences, Lonavala, Tal. Maval, Dist. Pune, Maharashtra, 410401 (INDIA) 3Department of Pharmaceutical Chemistry, SES’s, R. C. Patel Institute of Pharmaceutical Education and Re- search, Karwand Naka, Shirpur, Dist. Dhule, Maharashtra, 425 405, (INDIA) E-mail: bmf.jscopr@gmail.com ABSTRACT KEYWORDS Amlodipine; Nebivolol; Antihypertensive agents; Simultaneous equations; UV spectrophotometry. A simple, accurate and precise spectroscopic method was developed for simultaneous estimation of amlodipine and nebivolol (in pure and in their pharmaceutical dosage form). The method involves solving of simulta- neous equations based on measurement of absorbances at two wavelengths 242.0nm and 286.8nm which are the wavelength maxima of amlodipine and nebivolol, respectively. The method was successfully applied for si- multaneous determination of amlodipine and nebivolol in binary mixture. 2016 Trade Science Inc. - INDIA INTRODUCTION sion and may protect against vascular damage as it inhibits leukocyte activation and vascular smooth muscle cell proliferation.[2] Hence the combination of amlodipine and nebivolol is indicated for the treat- ment of hypertension and angina pectoris. Amlodipine and nebivolol are not official in any of the Pharmacopoeia and hence no official meth- Amlodipine {2-[(2-amino ethoxy) methyl)]-4-(2- chloro phenyl)-3-ethoxycarbonyl-5-methoxy carbo- nyl - 6- methyl- 1, 4- dihydropyridine} (Figure 1) is a calcium channel blocker. It occupies the plasma membrane dihydropyridine receptor and causes competitive blockage of voltage operated slow cal- cium channel.[1] Nebivolol {1-(6-fluorochroman-2- yl)-2-[[2-(6- fluorochroman-2-yl)-2-hydroxy-ethyl] amino] ethanol} (Figure 2) is a competitive and highly selective, third generation â1-blocker which achieves blood pressure control by modulating ni- tric oxide (NO) release. Nitric oxide is produced in artery walls and acts to relax vascular smooth muscle cells. It also inhibits platelet aggregation and adhe- Figure 1 : Chemical structure of amlodipine
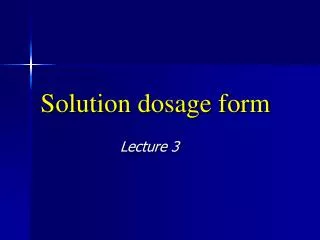
ACAIJ, 16(5) 2016 Bhushan M.Firake et al. 221 Full Paper Full Paper method for simultaneous spectroscopic estimation of amlodipine and nebivolol in two-component tab- let formulation. Figure 2 : Chemical structure of nebivolol EXPERIMENTAL ods for their estimation have been reported. For amlodipine, other methods reported in literature are a spectrophotometric method[3], fluorimetric[4], RP- HPLC[5], and HPTLC[6]. While for nebivolol, HPLC[7] and LC-MS[8] methods have been reported. There is no any method reported for simultaneous estimation of amlodipine and nebivolol in fixed dose combination. The aim of this study was to develop a simple, accurate, economical and reproducible Amlodipine and nebivolol were obtained as gift samples from Torrent Pharmaceuticals Ltd., Indrad and Cadila Pharmaceuticals Ltd., Ahmedabad, re- spectively. Methanol used was of analytical grade and obtained from Qualigens. A commercial tablet formulation (Nodon AM®) each containing 5mg of amlodipine and 5mg of nebivolol were procured from the local pharmacy. PC based Systronics Figure 3 : Overlain spectra of amlodipine and nebivolol in the ratio 1:1 Figure 4 : Calibration curve of amlodipine at 242.0nm. Analytical Analytical CHEMISTRY Analytical Analytical CHEMISTRY An Indian Journal
Simultaneous spectrophotometric estimation of amlodipine and nebivolo . 222 ACAIJ, 16(5) 2016 Full Paper Full Paper Double Beam Spectrophotometer 2202 (with 10mm matched quartz cell). Preparation of standard solutions Standard stock solution of amlodipine and nebivolol were prepared by separately dissolving 10mg of amlodipine and nebivolol, respectively in 100ml methanol. Stock solutions were diluted sepa- rately with methanol so as to get final concentration 20g/ml of each amlodipine and nebivolol. Determination of absorption spectra and analyti- cal wavelength Working standard solutions as prepared above were scanned in the range 200-400nm against metha- nol as blank to determine wavelength of maximum absorption. The overlain spectrum (Figure 3) was recorded using 10mm cell over the range 400nm to 200nm against blank. Wavelengths of maximum ab- sorption (ëmax) were found to be 242.0nm and 272.4nm for amlodipine and nebivolol, respectively. Simultaneous equations method was developed for analysis of amlodipine and nebivolol. Procedure for calibration curve For each drug, appropriate aliquots were pipetted out from standard stock solution into a series of eight 10ml volumetric flasks. Volume was made up to the mark with methanol to get solutions of concentra- tions of 0, 5, 10, 15, 20, 25, 30 and 35g/ml of each. Calibration curve for amlodipine (Figure 4) was constructed by plotting absorbance at 242.0nm against its concentration and Calibration curve for nebivolol (Figure 5) was constructed by plotting absorbance at 272.4nm against its concentration. Data for regression analysis is given in TABLE 1. By using the quantitative mode of instrument, in- tercept and slope values were obtained. Slope val- ues for amlodipine and nebivolol were 0.0403 and 0.0061, respectively. Intercept values were 0.013 and 0.0002 for amlodipine and nebivolol, respec- tively. The correlation coefficients for amlodipine and nebivolol were 0.9998 and 0.9997, respectively. The absorptivity values for amlodipine and nebivolol at both the wavelengths are presented in TABLE 2 and 3, respectively. The method employed simultaneous equations using Cramer’s rule and matrices. A set of two si- multaneous equations was framed using the absorp- tivity coefficient values as given below, A1 = (476.62 X C1) – (23.80 X C2) A2 = (15.93 X C1) – (132.39 X C2) Where, C1 and C2 are concentration (gm/100ml) of amlodipine and nebivolol, respectively in the sample solution. A1 and A2 are the absorbances of the sample solution measured at 242.0nm and 286.8nm, respec- tively. 476.62 and 23.80 are the absorptivities at 242.0nm while 15.93 and 132.39 are the absorp- tivities at 286.8nm of amlodipine and nebivolol, re- spectively. By applying the Cramer’s rule and matrices to equation 1 and 2, concentrations C1 and C2 can be (1) (2) Figure 5 : Calibration curve of nebivolol at 286.8nm. Analytical Analytical CHEMISTRY Analytical Analytical CHEMISTRY An Indian Journal
ACAIJ, 16(5) 2016 Bhushan M.Firake et al. 223 Full Paper Full Paper TABLE 1 : Regression analysis of calibration curves Parameters Amlodipine 242.0 0-35 0.013 0.0403 (0.0004) 0.9998 Nebivolol 272.4 0-35 0.0002 0.0061 (0.0002) 0.9997 Wavelength (nm) Concentration range (g/ml) Intercept Slope (S.D.) Correlation coefficient(r) S.D. = Standard deviation TABLE 2 : Absorptivity values for amlodipine Concentration (g/100 mL) 0.0010346 0.0010104 0.0010028 0.0009764 0.0010252 Mean S.D. C.V. Sr. No. Absorptivity at 242.0nm Absorptivity at 286.8nm 1. 2. 3. 4. 5. 477.03 476.79 476.63 475.97 476.68 476.62 0.39 0.08 15.92 15.83 15.97 15.86 16.09 15.93 0.10 0.63 TABLE 3 : Absorptivity values for nebivolol Concentration (g/100 mL) 0.0010102 0.0010116 0.0010085 0.0009772 0.0010178 Mean S.D. C.V. Absorptivity at 242.0nm 23.93 23.79 23.63 23.97 23.68 23.80 0.15 0.63 Absorptivity at 286.8nm 133.03 132.19 131.88 132.57 132.28 132.39 0.43 0.32 Sr. No. 1. 2. 3. 4. 5. Analysis of marketed formulation The marketed formulation analyzed was Nodon AM® (manufactured by Cadila Pharmaceuticals Ltd.) containing 5mg amlodipine and 5mg nebivolol us- ing the proposed method. Twenty tablets were weighed separately and finely powdered. Accurately weighed quantities of tablet powder equivalent to AM (~10mg) were trans- ferred to series of six different 10.0ml volumetric flasks. Methanol (5ml) was taken to it and the flasks were shaken for 10min and volumes were adjusted up to the mark. The solutions were filtered through Whatman Filter Paper No.41. Portions of filtrate were diluted so as to get final concentration of AM obtained as, (3) (4) Analysis of laboratory prepared samples Before analyzing the marketed formulations, the method was validated by analyzing the standard stock solution mixed in appropriate ratios and random samples prepared containing 5, 15, 25g/ml of amlodipine and 10, 20, 30g/ml of nebivolol. The results of replicate determinations (n=6) by the pro- posed method were validated statistically and are shown in TABLE 4. Analytical Analytical CHEMISTRY Analytical Analytical CHEMISTRY An Indian Journal
Simultaneous spectrophotometric estimation of amlodipine and nebivolo . 224 ACAIJ, 16(5) 2016 Full Paper Full Paper TABLE 4 : Result of analysis of standard samples Analyte Amlodipine Nebivolol % Concentration* ± SD 100.14 ± 0.26 99.25 ± 0.76 Coefficient of Variance 0.26 0.77 *Average of six determinations. S.D. = Standard Deviation. TABLE 5 : Result of analysis of tablet formulation Label claim (mg) 5 5 % Concentration* ± SD 100.22 ± 0.26 99.66 ± 0.63 Formulation Drug Coefficient of Variance Amlodipine Nebivolol 0.25 0.63 Nodon AM® *. Average of six determinations S.D. = Standard Deviation. TABLE 6 : Result of recovery studies Concentration of added drug to final solution ( g/ml) Amlodipine 2 4 6 8 10 12 % Recovery Nebivolol 2 4 6 8 10 12 Mean S.D. C.V. Amlodipine 101.86 99.79 101.20 102.27 101.24 100.82 101.19 0.86 0.84 Nebivolol 98.80 98.20 98.12 100.20 95.20 98.20 98.78 0.81 0.82 20g/ml and NB 20g/ml. Then the absorbances of these resultant solutions were measured at 242.0nm, 286.8nm as A1 and A2, respectively and concentra- tions of the two drugs in sample were determined using equations (3) and (4). Statistical data of the results obtained after replicate determinations (n=6) are shown in TABLE 5. Recovery studies To study the accuracy, reproducibility and pre- cision of the proposed method, recovery studies were carried out by addition of standard drug solution to preanalyzed sample. Results of recovery studies were found to be satisfactory and are presented in TABLE 6. selected. The absorbances of both the drugs were found to be satisfactorily at selected wavelengths. The relationship between concentration and ab- sorbance for individual drugs was studied (Figure 4 and 5). A linear relationship was observed for both the drugs individually over the concentration range 5-35g/ml (Amlodipine) at 242.0 nm and 5- 35g/ml (Nebivolol) at 286.8nm. The absorptivity values for both the drugs were determined at the selected wavelengths (TABLE 2 and 3). On the basis of above studies, Simultaneous UV- Spectrophotometric Method i.e. Simultaneous Esti- mation Method was evolved and applied to labora- tory mixture of both drugs. The results were quite satisfactory (TABLE 4) and hence the method was extended for the estimation of drugs in pharmaceuti- cal preparation (TABLE 5). The values of coefficient of variation were sat- isfactorily low and recovery was close to 100% for both the drugs (TABLE 6). The magnitude of analytical background response RESULTS AND DISCUSSION From the Overlay Spectra of Amlodipine and Nebivolol (Figure 3), two wavelengths were se- lected for the estimation of both drugs by Simulta- neous Equation Method. A max of Amlodipine at 242.0nm and a max of Nebivolol at 286.8nm were Analytical Analytical CHEMISTRY Analytical Analytical CHEMISTRY An Indian Journal
ACAIJ, 16(5) 2016 Bhushan M.Firake et al. 225 Full Paper Full Paper [3] was recorded by calculation of limit of detection (LOD) and limit of quantitation (LOQ). An appro- priate number of blank samples (9 determinations) were scanned in the selected range and the standard deviations of these responses were calculated. LOD and LOQ were found to be 0.2 and 0.7µg/ml for amlodipine and 0.3 and 1.2µg/ml for nebivolol. The results indicated that the method was sensitive. N.Rahman, H.M.Nasrul; Spectrophotometric deter- mination of amlodipine besylate in drug formula- tions, J.Pharm.Biomed.Anal., 31(2), 381 (2003). Y.E.Mohamed, M.E.Nazlaa, A.M.Bahia, G.M.Nashwa; Simultaneous fluorimetric determina- tion of amidarone, Amlodipine and propafenone, Bull.Fac.Pharm.(Cairo Univ.), 36(1), 1 (1998). S.S.Zarapkar, N.S.Kanyawar; Simultaneous estima- tion of amlodipine and Losartan potassium in phar- maceutical dosage by reverse phase high perfor- mance liquid chromatography, Indian Drugs, 34(6), 350 (1997). A.P.Argekar, S.G.Powar; Development of HPTLC method for simultaneous estimation of atenolol and amlodipine in tablet J.Pharm.Biomed.Anal., 21, 1137 (2000). Y.Hassan, Aboul-Enein, I.J.Ali; Studies on the ef- fect of alcohols on the chiral discrimination mecha- nisms of amylose stationary phase on the enantioseparation of nebivolol by HPLC, Biochem.Biophy.Mtds., 48(2), 175 (2001). N.V.S.Ramakrishna, M.Koteshwara, S.Manoj, M.Santosh, D.P.Varma; Rapid quantification of nebivolol in human plasma by liquid chromatography coupled with electrospray ionization tandem J.Pharm.Biomed.Anal., 39(5), 1006 (2005). [4] [5] ACKNOWLEDGEMENTS [6] The authors are thankful to Torrent Pharmaceu- ticals Ltd., Indrad and Cadila Pharmaceuticals Ltd., Ahmedabad for providing standard samples of drugs and also the TVES College of Pharmacy, Faizpur, KYDSCT College of Pharmacy, Sakegaon and JSPM’s Jayawantrao Sawant College of Pharmacy & Research, Hadapsar, Pune for providing facili- ties to carry out work. dosage form, [7] [8] K.N.Vishwottam, REFERENCES [1] A.R.Gennaro; Eds., In, Remington: The science and practice of pharmacy, 19th Edition, Mack publish- ing company, 2, 963 (1995). [2] R.A.Lakshmana, M.Bharani, R.K.Raja, G.G.Sankar, Nebivolol; A cardioselective â1-adrenergic blocker, The Antiseptic, 103(1), 13 (2006). mass spectrometry, Analytical Analytical CHEMISTRY Analytical Analytical CHEMISTRY An Indian Journal