Download
1 / 10
100 likes | 242 Views
INVESTIGATING LIGHT-MATTER INTERACTIONS USING A MANUAL SPECTROMETER - A NEW CHM151 LAB. Developed by E. Kwan , H. Ohorodnyk, I. Miller, A. Orozco, and A. Dhirani with assistance from F. Bures and J. Jackiewicz (electronics) as well as J. Ford and F. Shaw (machining).

E N D
INVESTIGATING LIGHT-MATTER INTERACTIONS USING A MANUAL SPECTROMETER - A NEW CHM151 LAB Developed by E. Kwan, H. Ohorodnyk, I. Miller, A. Orozco, and A. Dhirani with assistance from F. Bures and J. Jackiewicz (electronics) as well as J. Ford and F. Shaw (machining). Department of Chemistry, University of Toronto.
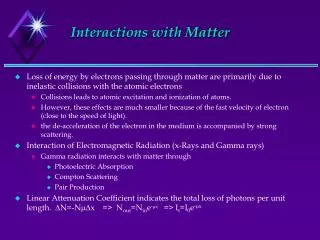
Introduction • Beer’s Law • Intensity of a beam of light decreases exponentially with the number of absorbing particles in the beam: I/I0 = 10-A where I is the final intensity, I0 is the initial intensity, and A is the absorbance. • A = c b, where is the extinction coefficient, c is the concentration of the solution, and b is the path length. • Goals of Project • Students explore the validity, limitations, and applications of Beer’s Law • Students are introduced to spectroscopy in a hands-on way
The Spectrometer Light Detector and I-V Converter Diffraction Grating Double Convex Lens Diffraction pattern Photodiode Sample Holder Multimeter Rails Lamp • Light intensity measured by photodiode and multimeter • Detector position on rail determines wavelength detected
Samples (1) Various filters (2) Copper (II) Sulfate (3) Chlorophyll Extracted chlorophyll Filter ground up leaves soaked in methanol Geraniums
Blue Filters: Background Removal • Red light intensity measured against number of filters • Data fit to y = y0 + y1 e-x/t, an exponential decay • y0 is the background (stray light)
Blue Filters: Absorbance Plot • Absorbance calculated as –log[(I-y0)/(I0-y0)] • Absorbance increases linearly with numbers of filters • Slope is 0.31 (represents absorbance per blue filter) • Signal:noise ratio gets much worse
Green Filters: Absorbance Plot • Absorbance increases linearly but with a different slope, 0.15. • Data measured at same red wavelength
Blue and Green Filters: Absorbance • Slope is now 0.45, statistically the same as the sum of 0.31 + 0.15 => slopes add when filters combined • So absorbance is additive
Copper Sulfate Absorbance • Absorbance increases linearly with concentration • Graph can now be used to determine concentration of a solution by measuring its absorbance
Spectroscopy of Chlorophyll Transmitted Light Chlorophyll appears red! Green Diffraction Maximum Light Shield Green Reflection Chlorophyll viewed in normal light Chlorophyll viewed from the side • Green light transmitted • Red light absorbed and re-emitted (sideways also) • Some blue light converted to red light -> fluorescence (covered slit with blue filter and observed red light out) Special thanks to P.E. Trudeau and Y. Suganuma