Download
1 / 72
730 likes | 752 Views
Econometrics 2 - Lecture 3 Univariate Time Series Models. Contents. Time Series Stochastic Processes Stationary Processes The ARMA Process Deterministic and Stochastic Trends Models with Trend Unit Root Tests Estimation of ARMA Models. Private Consumption. Private consumption in

E N D
Contents • Time Series • Stochastic Processes • Stationary Processes • The ARMA Process • Deterministic and Stochastic Trends • Models with Trend • Unit Root Tests • Estimation of ARMA Models Hackl, Econometrics 2, Lecture 3
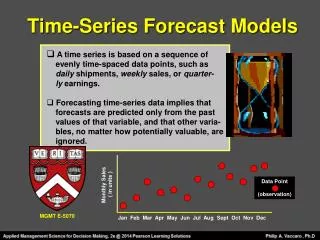
Private Consumption Private consumption in the EURO area (16 mem- bers), quarterly data, seasonally adjusted, AWM database (in MioEUR) Hackl, Econometrics 2, Lecture 3
Private Consumption: Growth Rate Yearly growth of private consumption in EURO area (16 members), AWM database (in MioEUR) Mean growth: 15.008 Hackl, Econometrics 2, Lecture 3
Disposable Income Disposable income, Austria (in Mio EUR) Hackl, Econometrics 2, Lecture 3
Time Series • Time-ordered sequence of observations of a random variable • Examples: • Annual values of private consumption • Yearly changes in expenditures on private consumption • Quarterly values of personal disposable income • Monthly values of imports • Notation: • Random variable Y • Sequence of observations Y1, Y2, ... , YT • Deviations from the mean: yt = Yt – E{Yt} = Yt – μ Hackl, Econometrics 2, Lecture 3
Components of a Time Series • Components or characteristics of a time series are • Trend • Seasonality • Irregular fluctuations • Time series model: represents the characteristics as well as possible interactions • Purpose of modeling • Description of the time series • Forecasting the future • Example: Quarterly observations of the disposable income • Yt = βt + ΣiγiDit + εt • with Dit = 1 if t corresponds to i-th quarter, Dit = 0 otherwise Hackl, Econometrics 2, Lecture 3
Contents • Time Series • Stochastic Processes • Stationary Processes • The ARMA Process • Deterministic and Stochastic Trends • Models with Trend • Unit Root Tests • Estimation of ARMA Models Hackl, Econometrics 2, Lecture 3
Stochastic Process Time series: realization of a stochastic process Stochastic process is a sequence of random variables Yt, e.g., {Yt, t = 1, ..., n} {Yt, t = -∞, ..., ∞} Joint distribution of the Y1, ... , Yn: p(y1, …., yn) Of special interest • Evolution of the expectation mt = E{Yt} over time • Dependence structure over time Example: Extrapolation of a time series as a tool for forecasting Hackl, Econometrics 2, Lecture 3
White Noise White noise process {Yt, t = -∞, ..., ∞} • E{Yt} = 0 • V{Yt} = σ² • Cov{Yt,Yt-s} = 0 for all (positive or negative) integers s i.e., a mean zero, serially uncorrelated, homoskedastic process Hackl, Econometrics 2, Lecture 3
AR(1)-Process States the dependence structure between consecutive observations as Yt = δ + θYt-1 + εt, |θ| < 1 with εt: white noise, i.e., V{εt} = σ² (see next slide) • Autoregressive process of order 1 From Yt = δ + θYt-1 + εt = δ + θδ + θ²δ +… +εt + θεt-1 + θ²εt-2 +… follows E{Yt} = μ = δ(1-θ)-1 • |θ| < 1 needed for convergence! Invertibility condition In deviations from μ, yt = Yt – m: yt = θyt-1 + εt Hackl, Econometrics 2, Lecture 3
AR(1)-Process, cont’d Autocovariances γk = Cov{Yt,Yt-k} • k=0: γ0 = V{Yt} = θ²V{Yt-1} + V{εt} = … = Σi θ2i σ² = σ²(1-θ²)-1 • k=1: γ1 = Cov{Yt,Yt-1} = E{ytyt-1} = E{(θyt-1+εt)yt-1} = θV{yt-1} = θσ²(1-θ²)-1 • In general: γk = Cov{Yt,Yt-k} = θkσ²(1-θ²)-1, k = 0, ±1, … depends upon k, not upon t! Hackl, Econometrics 2, Lecture 3
MA(1)-Process States the dependence structure between consecutive observations as Yt = μ + εt + αεt-1 with εt: white noise, V{εt} = σ² Moving average process of order 1 E{Yt} = μ Autocovariances γk = Cov{Yt,Yt-k} • k=0: γ0 = V{Yt} = σ²(1+α²) • k=1: γ1 = Cov{Yt,Yt-1} = ασ² • γk = 0 for k = 2, 3, … • Depends upon k, not upon t! Hackl, Econometrics 2, Lecture 3
AR-Representation of MA-Process The AR(1) can be represented as MA-process of infinite order yt = θyt-1 + εt = Σ∞i=0 θiεt-i given that |θ| < 1 Similarly: the AR representation of the MA(1) process yt = αyt-1 – α²yt-2± … + εt = Σ∞i=0 (-1)i αi+1yt-i-1 + εt given that |α| < 1 Hackl, Econometrics 2, Lecture 3
Contents • Time Series • Stochastic Processes • Stationary Processes • The ARMA Process • Deterministic and Stochastic Trends • Models with Trend • Unit Root Tests • Estimation of ARMA Models Hackl, Econometrics 2, Lecture 3
Stationary Processes Refers to the joint distribution of Yt’s, in particular to second moments (Weak) stationary or covariance stationary process: the first two moments are finite and not affected by a shift of time E{Yt} = μfor all t Cov{Yt, Yt+k} = γk, k = 0, ±1, … for all t and all k Cov{Yt, Yt+k}, k = 0, ±1,…: covariance function; γt,k = γt,-k A process is called strictly stationary if its stochastic properties are unaffected by a change of the time origin • The joint probability distribution at any set of times is not affected by an arbitrary shift along the time axis Hackl, Econometrics 2, Lecture 3
AC and PAC Function Autocorrelation function (AC function, ACF) Independent of the scale of Y • For a stationary process: ρk = Corr{Yt,Yt-k} = γk/γ0, k = 0, ±1,… • Properties: • |ρk| ≤ 1 • ρk = ρ-k • ρ0 = 1 • Correlogram: graphical presentation of the AC function Partial autocorrelation function (PAC function, PACF): θkk = Corr{Yt, Yt-k|Yt-1,...,Yt-k+1}, k = 0, ±1, … • θkk is obtained from Yt = θk0 + θk1Yt-1 + ... + θkkYt-k • Partial correlogram: graphical representation of the PAC function Hackl, Econometrics 2, Lecture 3
Examples for the AC and PAC functions: • White noise ρ0 = θ00 = 1 ρk = θkk = 0, if k≠ 0 white noise is stationary • AR(1) process, Yt = δ + θYt-1 + εt ρk = θk, k = 0, ±1,… θ00 = 1, θ11 = θ, θkk = 0 for k > 1 • MA(1) process, Yt = μ + εt + αεt-1 ρ0 = 1, ρ1= α/(1 + α2), ρk = 0 for k > 1 PAC function: damped exponential if α > 0, alternating and damped exponential if α < 0 Hackl, Econometrics 2, Lecture 3
Stationarity of MA- and AR- Processes MA processes are stationary • Weighted sum of white noises • E.g., MA(1) process: Yt = μ + εt + αεt-1 ρ0 = 1, ρ1= α/(1 + α2), ρk = 0 for k > 1 An AR process is stationary if it is invertible • AR(1) process, Yt = θYt-1 + εt = Σ∞i=0θiεt-i if |θ| < 1 (invertibility condition) ρk = θk, k = 0, ±1,… Hackl, Econometrics 2, Lecture 3
AC and PAC Function: Estimates • Estimator for the AC function ρk: • Estimator for the PAC function θkk: coefficient of Yt-k in the regression of Yt on Yt-1, …, Yt-k Hackl, Econometrics 2, Lecture 3
AR(1) Processes, Verbeek, Fig. 8.1 Hackl, Econometrics 2, Lecture 3
MA(1) Processes, Verbeek, Fig. 8.2 Hackl, Econometrics 2, Lecture 3
Contents • Time Series • Stochastic Processes • Stationary Processes • The ARMA Process • Deterministic and Stochastic Trends • Models with Trend • Unit Root Tests • Estimation of ARMA Models Hackl, Econometrics 2, Lecture 3
The ARMA(p,q) Process Generalization of the AR and MA processes: ARMA(p,q) process yt = θ1yt-1 + … + θpyt-p + εt + α1εt-1 + … + αqεt-q with white noise εt Lag (or shift) operator L (Lyt= yt-1, L0yt = Iyt= yt, Lpyt= yt-p) ARMA(p,q) process in operator notation θ(L)yt = α(L)εt with operator polynomials θ(L) and α(L) θ(L) = I - θ1L - … - θpLp α(L) = I + α1L + … + αqLq Hackl, Econometrics 2, Lecture 3
Lag Operator Lag (or shift) operator L • Lyt = yt-1, L0yt = Iyt = yt, Lpyt = yt-p • Algebra of polynomials in L like algebra of variables Examples: • (I - ϕ1L)(I - ϕ2L) = I – (ϕ1+ ϕ2)L +ϕ1ϕ2L2 • (I - θL)-1 = Σ∞i=0θiLi • MA(∞) representation of the AR(1) process yt = (I - θL)-1εt the infinite sum defined only (e.g., finite variance) if |θ| < 1 • MA(∞) representation of the ARMA(p,q) process yt = [θ(L)]-1α(L)εt similarly the AR(∞) representations; invertibility condition: restrictions on parameters Hackl, Econometrics 2, Lecture 3
Invertibility of Lag Polynomials Invertibility condition for lag polynomial θ(L) = I - θL: |θ| < 1 Invertibility condition for lag polynomial of order 2, θ(L) = I - θ1L - θ2L2 • θ(L) = I - θ1L - θ2L2 = (I - ϕ1L)(I - ϕ2L) with ϕ1+ϕ2 = θ1 and -ϕ1ϕ2 = θ2 • Invertibility conditions: both (I – ϕ1L) and (I – ϕ2L) invertible; |ϕ1| < 1, |ϕ2| < 1 Invertibility in terms of the characteristic equation θ(z) = (1- ϕ1z) (1- ϕ2z) = 0 • Characteristic roots: solutions z1, z2 from (1- ϕ1z) (1- ϕ2z) = 0 z1 = ϕ1-1, z2 = ϕ2-1 • Invertibility conditions: |z1| = |ϕ1-1| > 1, |z2| = |ϕ2-1| > 1 Polynomial θ(L) is not invertible if any solution zi fulfills |zi| ≤ 1 Can be generalized to lag polynomials of higher order Hackl, Econometrics 2, Lecture 3
Unit Root and Invertibility Lag polynomial of order 1: θ(z) = (1-θz) = 0, • Unit root: characteristic root z = 1; implies θ = 1 • Invertibility condition |θ| < 1 is violated, AR process Yt = θYt-1 + εt is non-stationary Lag polynomial of order 2 • Characteristic equation θ(z) = (1- ϕ1z) (1- ϕ2z) = 0 • Characteristic roots zi = 1/ϕi, i = 1, 2 • Unit root: a characteristic root zi of value 1; violates the invertibility condition |z1| = |ϕ1-1| > 1, |z2| = |ϕ2-1| > 1 • AR(2) process Yt is non-stationary AR(p) process: polynomial θ(z) = 1 - θ1z - … - θpLp, evaluated at z = 1, is zero, given Σiθi = 1: Σiθi = 1 indicates a unit root Tests for unit roots are important tools for identifying stationarity Hackl, Econometrics 2, Lecture 3
Contents • Time Series • Stochastic Processes • Stationary Processes • The ARMA Process • Deterministic and Stochastic Trends • Models with Trend • Unit Root Tests • Estimation of ARMA Models Hackl, Econometrics 2, Lecture 3
Types of Trend Trend: The development of the expected value of a process over time; typically an increasing (or decreasing) pattern • Deterministic trend: a function f(t) of the time, describing the evolution of E{Yt} over time Yt = f(t) + εt, εt: white noise Example: Yt = α + βt + εt describes a linear trend of Y; an increasing trend corresponds to β > 0 • Stochastic trend: Yt = δ + Yt-1 + εt or ΔYt = Yt – Yt-1 = δ + εt, εt: white noise • describes an irregular or random fluctuation of the differences ΔYt around the expected value δ • AR(1) – or AR(p) – process with unit root • “random walk with trend” Hackl, Econometrics 2, Lecture 3
Example: Private Consumption Private consumption, AWM database; level values (PCR) and first differences (PCR_D) Mean of PCD_D: 3740 Hackl, Econometrics 2, Lecture 3
20 16 12 8 4 0 -4 -8 -12 10 20 30 40 50 60 70 80 90 100 random walk random walk with trend AR(1) process, δ=0.2, θ=0.7 Trends: Random Walk and AR Process Random walk: Yt= Yt-1 + εt; random walk with trend: Yt= 0.1 +Yt-1 + εt; AR(1) process: Yt= 0.2 + 0.7Yt-1 + εt; εtsimulated from N(0,1) Hackl, Econometrics 2, Lecture 3
Random Walk withTrend The random walk with trend Yt = δ + Yt-1 + εt can be written as Yt = Y0 + δt + Σi≤t εi δ: trend parameter Components of the process • Deterministic growth path Y0 + δt • Cumulative errors Σi≤t εi Properties: • Expectation Y0 + δt is depending on Y0, i.e., on the origin (t=0)! • V{Yt} = σ²t becomes arbitrarily large! • Corr{Yt,Yt-k} = √(1-k/t) • Random walk with trend is non-stationary! Hackl, Econometrics 2, Lecture 3
Random Walk withTrend, cont’d From Corr{Yt,Yt-k} = √(1-k/t) follows • For fixed k,Yt and Yt-k are the stronger correlated, the larger t • With increasing k, correlation tends to zero, but the slower the larger t (long memory property) Comparison of random walk with the AR(1) process Yt = δ + θYt-1 + εt • AR(1) process: εt-i has the lesser weight, the larger i • AR(1) process similar to random walk when θ is close to one Hackl, Econometrics 2, Lecture 3
Non-Stationarity: Consequences AR(1) process Yt = θYt-1 + εt • OLS estimator for θ: • For |θ| < 1: the estimator is • consistent • asymptotically normally distributed • For θ = 1 (unit root) • θ is underestimated • estimator not normally distributed • spurious regression problem Hackl, Econometrics 2, Lecture 3
Integrated Processes In order to cope with non-stationarity • Trend-stationary process: the process can be transformed in a stationary process by subtracting the deterministic trend • E.g., Yt = f(t) + εt with white noise εt: Yt–f(t) = εt is stationary • Difference-stationary process, or integrated process: stationary process can be derived by differencing • E.g.,Yt = δ + Yt-1 + εt, E.g., Yt–Yt-1 = δ + εt is stationary Integrated process: stochastic process Y is called • integrated of order one if the first difference yield a stationary process: Y ~ I(1) • integrated of order d, if the d-fold differences yield a stationary process: Y ~ I(d) Hackl, Econometrics 2, Lecture 3
I(0)- vs. I(1)-Processes I(0) process, e.g.,Yt = δ + εt • Fluctuates around the process mean with constant variance • Mean-reverting • Limited memory I(1) process e.g.,Yt = δ + Yt-1 + εt • Fluctuates widely • Infinitely long memory • Persistent effect of shocks Hackl, Econometrics 2, Lecture 3
Integrated Stochastic Processes Many economic time series show stochastic trends From the AWM Database ARIMA(p,d,q) process: d-th differences follow an ARMA(p,q) process Hackl, Econometrics 2, Lecture 3
Contents • Time Series • Stochastic Processes • Stationary Processes • The ARMA Process • Deterministic and Stochastic Trends • Models with Trend • Unit Root Tests • Estimation of ARMA Models Hackl, Econometrics 2, Lecture 3
Example: Model for a Stochastic Trend Data generation: random walk (without trend): Yt = Yt-1 + εt, εt: white noise • Realization of Yt: is a non-stationary process, stochastic trend • V{Yt}: a multiple of t Specified model: Yt = α + βt + εt • Deterministic trend • Constant variance • Miss-specified model! Consequences for OLS estimator for β • t- and F-statistics: wrong critical limits, rejection probability too large • R2 indicates explanatory potential although Yt random walk without trend • “spurious regression” or “nonsense regression” Hackl, Econometrics 2, Lecture 3
White Noise and Random Walk Computer-generated random numbers • eps: white noise, i.e., N(0,1)-distributed • Y: random walk Yt = Yt-1 + epst Hackl, Econometrics 2, Lecture 3
Random Walk and Deterministic Trend Fitting the deterministic trend model Yt = α + βt + εt to the random walk data results in -0.92 +0.096 t with t-statistic 19.77 for b, R2 = 0.66, and Durbin Watson statistic 0.066 Hackl, Econometrics 2, Lecture 3
How to Model Trends? Specification of • Deterministic trend, e.g., Yt = α + βt + εt: risk of spurious regression, wrong decisions • Stochastic trend: analysis of differences ΔYt if a random walk, i.e., a unit root, is suspected Consequences of spurious regression are more serious Consequences of modeling differences ΔYt: • Autocorrelated errors • Consistent estimators • Asymptotically normally distributed estimators • HAC correction of standard errors, i.e., heteroskedasticity and autocorrelation consistent estimates of standard errors Hackl, Econometrics 2, Lecture 3
Elimination of Trend Random walk Yt = δ + Yt-1 + εt with white noise εt ΔYt = Yt – Yt-1 = δ + εt • ΔYt is a stationary process • A random walk is a difference-stationary or I(1) process Linear trend Yt = α + βt + εt • Subtracting the trend component α + βt provides a stationary process • Yt is a trend-stationary process Hackl, Econometrics 2, Lecture 3
Contents • Time Series • Stochastic Processes • Stationary Processes • The ARMA Process • Deterministic and Stochastic Trends • Models with Trend • Unit Root Tests • Estimation of ARMA Models Hackl, Econometrics 2, Lecture 3
Unit Root Tests AR(1) process Yt = δ + θYt-1 + εt with white noise εt • Dickey-Fuller or DF test (Dickey & Fuller, 1979) Test of H0: θ = 1 against H1: θ < 1, i.e., H0 states Y ~ I(1), Y is non-stationary • KPSS test (Kwiatkowski, Phillips, Schmidt & Shin, 1992) Test of H0: θ < 1 against H1: θ = 1, i.e., H0 states Y ~ I(0), Y is stationary • Augmented Dickey-Fuller or ADF test extension of DF test • Various modifications like Phillips-Perron test, Dickey-Fuller GLS test, etc. Hackl, Econometrics 2, Lecture 3
Dickey-Fuller‘s Unit Root Test AR(1) process Yt = δ + θYt-1 + εt with white noise εt OLS Estimator for θ: Test statistic Distribution of DF • If |θ| < 1: approximately t(T-1) • If θ = 1: Dickey & Fuller critical values DF test for testing H0: θ = 1 against H1: θ < 1 • θ = 1: characteristic equation 1 – θz = 0 has unit root Hackl, Econometrics 2, Lecture 3
Dickey-Fuller Critical Values Monte Carlo estimates of critical values for DF0: Dickey-Fuller test without intercept; Yt = θYt-1 + εt DF: Dickey-Fuller test with intercept; Yt = δ + θYt-1 + εt DFτ: Dickey-Fuller test with time trend; Yt = δ + γt + θYt-1 + εt Hackl, Econometrics 2, Lecture 3
Unit Root Test: The Practice AR(1) process Yt = δ + θYt-1 + εt with white noise εt can be written with π = θ -1 as ΔYt = δ + πYt-1 + εt DF tests H0: π = 0 against H1: π < 0 test statistic for testing π = θ -1 = 0 identical with DF statistic Two steps: • Regression of ΔYt on Yt-1: OLS-estimator for π = θ - 1 • Test of H0: π = 0 against H1: π < 0 based on DF; critical values of Dickey & Fuller Hackl, Econometrics 2, Lecture 3
Example: Price/Earnings Ratio Verbeek’s data set PE: annual time series data on composite stock price and earnings indices of the S&P500, 1871-2002 • PE: price/earnings ratio • Mean 14.6 • Min 6.1 • Max 36.7 • St.Dev. 5.1 • log(PE) • Mean 2.63 • Min 1.81 • Max 3.60 • St.Dev. 0.33 Hackl, Econometrics 2, Lecture 3
Price/Earnings Ratio, cont’d Fitting an AR(1) process to the log(PE) data gives: ΔYt = 0.335 – 0.125Yt-1 with t-statistic -2.569 (for Yt-1) and p-value 0.1021 • p-value of the DF statistic (-2.569): 0.102 • 1% critical value: -3.48 • 5% critical value: -2.88 • 10% critical value: -2.58 • H0: θ = 1 (non-stationarity) cannot be rejected for the log(PE) Unit root test for first differences: ΔΔYt = 0.008 – 0.9935ΔYt-1, DF statistic -10.59, p-value 0.000 (1% critical value: -3.48) • log(PE) is I(1) However: for sample 1871-1990: DF statistic -3.65, p-value 0.006; within the period 1871-1990, the log(PE) is stationary Hackl, Econometrics 2, Lecture 3