Download
1 / 19
210 likes | 513 Views
Possible excitation of the Chandler wobble by the annual oscillation of polar motion. Kosek Wiesław Space Research Centre, Polish Academy of Sciences. Annual Seminar of Commission of Satellite Geodesy,

E N D
Possible excitation of the Chandler wobble by the annual oscillation of polar motion Kosek Wiesław Space Research Centre, Polish Academy of Sciences Annual Seminar of Commission of Satellite Geodesy, Committee Space Research PASSection of Geodetic Networks, Committee of Geodesy PAS, Section of Geodynamics, Committee of Geodesy PAS, Space Research Centre PAS. EARTH ROTATION AND SATELLITE GEODESY- FROM ASTROMETRY TO GNSS Warsaw, 18-19 September 2003
Chandler wobble excitation • The atmospheric wind and IB pressure variations maintain a major part of the observed Chandler Wobble. However the wind signal dominates over the IB pressure term in the vicinity of the Chandler frequency (Furuya et al. 1996; Aoyama and Naito 2001). • Celaya et al. (1999) using the results of a coupled atmosphere-ocean-land climate model, concluded that some combination of atmospheric and oceanic processes probably have enough power to excite the Chandler wobble. • Using an 11-year time series of the OAM Brzeziński and Nastula (2002) concluded that, within the limits of accuracy, the coupled system atmosphere/ocean fully explains the observed Chandler wobble during the period 1985-1996. • The most important mechanism exciting the Chandler wobble in 1985-1996 was ocean-bottom pressure fluctuations, which contribute about twice as much excitation power as do atmospheric pressure fluctuations (Gross 2002).
Data • EOPC01 (1846.0 - 2000.0), Δt=0.05 yrhttp://hpiers.obspm.fr/eop-pc/ • EOPC04 (1962.0 - 2003.6), Δ t = 1 day http://hpiers.obspm.fr/eop-pc/ • USNO (1976.0 - 2003.6), Δ t = 1 day (finals.all ) http://maia.usno.navy.mil/bulletin-a.html
The FTBPF amplitude spectra of complex-valued pole coordinate data in 1900-2003
Chandler The most energetic oscillations of polar motion computed by the FTBPF Annual
The amplitudes and phases of the Chandler and annual oscillations computed by the LS in 3 year time intervals, the Niño indices
The amplitude of the Chandler oscillation computed from the x, y data by the FTBPF and from the x – i y data bythe LS method in 5 year time intervals
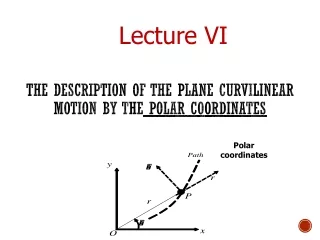
Transformation of x, y pole coordinates data to polar coordinate system mean pole angular velocity radius length of polar motion path
The mean pole computed by the Ormsby LPF - filter length, - number of data, - pole coordinates data, -cutoff frequency,-cutoff period, - roll-off termination frequency. 1849 2003
Corr. Coeff. 1900-2003 0.864 1950-2003 0.899
The FTBPF time-frequency amplitude spectra of polar motion radius and angular velocity
The time-frequency coherence between the radius and angular velocity computed using the Morlet Wavelet Transform
The length of polar motion path and the envelope of the Chandler oscillation
LS Phases computed in 5 year time intervals of the Chandler and annual oscillations, periods estimated from them and the beat period
The beat period of the Chandler and annual oscillation computed from their LS phases in 5 and 6 year time intervals. First derivative of the Chandler amplitude computed by the LS in 5 year time intervals and by the FTBPF. The Niño indices.
The amplitudes and phases of 6-7yr oscillation in the radius computed in 12,13 year time intervals by the LS method. The periods computed from the phases
The periods of the 6-7 yr oscillation in the radius computed from the LS phases in 12,13 year time intervals. Beat period of the Chandler and annual oscillations computed from the LS phases in 5 and 6 year time intervals. First derivative of the Chandler amplitudes computed by the LS in 4, 5 and 6 year time intervals. Corr. Coeff. 1984-1997 0.510 Corr. Coeff. 1984-2000 0.654
Conclusions • Amplitudes and phases of the Chandler oscillation are smoother than those of the annual oscillation. • The phase of the annual oscillation had maximum values and the beat period of the Chandler and annual oscillation had minimum values before the biggest 1982/83 and 1997/98 El Niño events. • Long period variations with periods greater than 6 years in the length of polar motion path are due to variable amplitude of the Chandler oscillation. • The increase of the Chandler oscillation amplitude is associated with the increase of the beat period of the Chandler and annual oscillations. It means that the annual oscillation period gets closer to the Chandler one. Thus, the Chandler amplitude increases during increase of the period (decrease of the phase) of the annual oscillation. The Chandler oscillation can be excited by variable annual oscillation.