Download
1 / 67
700 likes | 1.02k Views
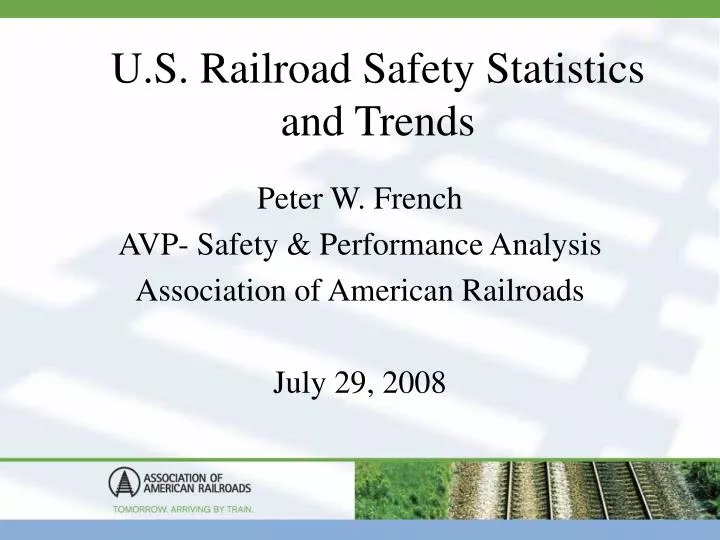
U.S. Railroad Safety Statistics and Trends. Peter W. French AVP- Safety & Performance Analysis Association of American Railroads July 29, 2008. Railroad Safety: Topics. Safety Statistics & Trends Train Safety (Train Accidents) Grade Crossing Safety Trespassers Passenger Safety

E N D
U.S. Railroad Safety Statistics and Trends Peter W. French AVP- Safety & Performance Analysis Association of American Railroads July 29, 2008
Railroad Safety: Topics • Safety Statistics & Trends • Train Safety (Train Accidents) • Grade Crossing Safety • Trespassers • Passenger Safety • Employee Safety • Hazardous Materials Safety
Railroad Safety: Topics (continued) • RR Initiatives to Improve Safety • Improvements in Technology • Safety Programs • Risk-Based Safety Performance Standards
U.S. Railroad Safety Statistics:Main Themes • Railroads have dramatically improved safety over the last two and a half decades. • Railroads compare favorably with other industries & transportation modes. • The most troubling railroad safety problems arise from factors largely outside railroad control. • Railroads have implemented numerous and effective technological improvements and company-wide safety programs.
U.S. Railroad Safety Statistics: In 2007, U.S. railroads achieved their safest year ever by the following major safety yardsticks: • Train Accident Rate, down 10% from 2006. • Grade Crossing Collisions and Collision Rates, down 6% and 4% from 2006. Employee Casualties and Rates missed the 2006 records by 0.8% and 1.4%. Sources: FRA website: http://safetydata.fra.dot.gov/Prelim/2007/r01.htm (Preliminary 2007 data) FRA, Railroad Safety Statistics Annual Report, 1997-2005, Tables 1-1, 1-2. FRA, Accident/Incident Bulletin, 1975-1996, Tables 1, 51.
In 2007, 95% of rail-related fatalities weregrade crossing users and trespassers. Grade Crossing Users: 337 (39%) Trespassers: 473 (56%) Employees: 17 Passengers: 4 Others: 20 Sources: FRA website: http://safetydata.fra.dot.gov/Prelim/2007/r03.htm (preliminary 2007 data). FRA, Railroad Safety Statistics Annual Report 2005, Table 1-3.
In 2007, 60% of rail-related injuries were incurred by employees on duty. Trespassers: 398 Grade Crossing Users: 828 Passengers: 1,058 Others: 1,254 Employees 5,263 Sources: FRA website: http://safetydata.fra.dot.gov/Prelim/2007/r03.htm (preliminary 2007 data). FRA, Railroad Safety Statistics Annual Report 2005, Table 1-3.
Train accidents per million train-miles have dropped 71% since 1980 and 30% since 1990, to a new low. 11.43 4.73 3.54 3.29 Sources: FRA website: http://safetydata.fra.dot.gov/Prelim/2007/r01.htm (preliminary 2007 data). FRA, Railroad Safety Statistics Annual Report, 1997-2005, Tables 1-1, 1-2. FRA, Accident/Incident Bulletin, 1980-1996, Tables 19, 36. Note: Excludes grade crossing accidents.
Train collisions per million train-miles have dropped 85% since 1980 and 51% since 1990. 1.67 0.52 0.25 Sources: FRA website: http://safetydata.fra.dot.gov/Prelim/2007/r01.htm (preliminary 2007 data). FRA, Railroad Safety Statistics Annual Report, 1997-2005, Tables 1-1, 5-6. FRA, Accident/Incident Bulletin, 1980-1996, Tables 19, 36. Note: Excludes grade crossing collisions.
Mainline train collisions per million train-miles on Class I freight railroads have dropped 85% since 1980 and 54% since 1990. 0.54 0.52 All Collisions: All RRs 0.37 Mainline & Sidings: Class I Freight RRs All Consists 0.254 0.17 Frt Trains Only 0.12 0.080 0.057 Sources: FRA website: http://safetydata.fra.dot.gov/Prelim/2007/r01.htm. AAR Analysis of FRA train accident database through 2007. FRA, Railroad Safety Statistics Annual Report, 1997-2005, Tables 1-1, 5-6; FRA, Accident/Incident Bulletin, 1980-1996, Tables 19, 36. Note: Excludes grade crossing collisions. Includes passenger train collisions on Class I freight railroads.
Derailments per million train-miles have dropped 74% since 1980 and 33% since 1990, to a new low. 8.98 3.52 2.38 Sources: FRA website: http://safetydata.fra.dot.gov/Prelim/2007/r01.htm & r02.htm (preliminary 2007 data) FRA, Railroad Safety Statistics Annual Report, 1997-2005, Tables 1-1, 5-6. FRA, Accident/Incident Bulletin, 1980-1996, Tables 19, 36. Note: Excludes grade crossing accidents.
Equipment-caused accidents per million train-miles have dropped 80% since 1980 and 42% since 1990. 2.03 0.70 0.40 Sources: FRA website: http://safetydata.fra.dot.gov/Prelim/2007/r01.htm & r02.htm (preliminary 2007 data) FRA, Railroad Safety Statistics Annual Report, 1997-2005, Tables 1-1, 5-9. FRA, Accident/Incident Bulletin, 1980-1996, Tables 19, 36. Note: Excludes grade crossing accidents.
Track-caused accidents per million train-miles have dropped 76% since 1980 and 28% since 1990, to a new low. 4.84 1.60 1.15 Sources: FRA website: http://safetydata.fra.dot.gov/Prelim/2007/r01.htm & r02.htm (preliminary 2007 data) FRA, Railroad Safety Statistics Annual Report, 1997-2005, Tables 1-1, 5-9. FRA, Accident/Incident Bulletin, 1980-1996, Tables 19, 36. Note: Excludes grade crossing accidents.
Human factors-caused accidents per million train-miles have dropped 61% since 1980 and 30% since 1990. 3.24 1.80 1.26 Sources: FRA website: http://safetydata.fra.dot.gov/Prelim/2007/r01.htm & r02.htm (preliminary 2007 data) FRA, Railroad Safety Statistics Annual Report, 1997-2005, Tables 1-1, 5-9. FRA, Accident/Incident Bulletin, 1980-1996, Tables 19, 36. Note: Excludes grade crossing accidents.
Brake equipment-related train accidents have dropped 85% since 1980 and 43% since 1990. 187 49 28 Sources: FRA, Railroad Safety Statistics Annual Report, 1997-2005, Table 5-9. FRA Accident/Incident Bulletin, 1980-1996, Table 19. AAR Analysis of FRA Train Accident Database through 2007. Note: Includes accidents due to locomotive brake defects.
Brake equipment-related train accident rates have dropped 86% since 1980 and 56% since 1990. Accidents per Million Train-Miles 0.261 0.080 0.035 Sources: FRA, Railroad Safety Statistics Annual Report, 1997-2005, Table 1-1, 5-9. FRA Accident/Incident Bulletin, 1980-1996, Table 19, 36. AAR Analysis of FRA Train Accident Database through 2007. Note: Includes accidents due to locomotive brake defects.
Wheel equipment-related train accident rates have dropped 85% since 1980 and 54% since 1990. Accidents per Million Train-Miles 0.411 0.135 0.062 Sources: FRA, Railroad Safety Statistics Annual Report, 1997-2005, Table 1-1, 5-9. FRA Accident/Incident Bulletin, 1980-1996, Table 19, 36. AAR Analysis of FRA Train Accident Database through 2007. Note: Includes accidents due to locomotive wheel defects.
Axle and bearings-related train accident rates have dropped 78% since 1980 and 54% since 1990. Accidents per Million Train-Miles 0.287 0.138 0.063 Sources: FRA, Railroad Safety Statistics Annual Report, 1997-2005, Table 1-1, 5-9. FRA Accident/Incident Bulletin, 1980-1996, Table 19, 36. AAR Analysis of FRA Train Accident Database through 2007. Note: Includes accidents due to locomotive axle or bearing defects.
Truck component-related train accident rates have dropped 83% since 1980 and 50% since 1990. Accidents per Million Train-Miles 0.450 0.153 0.076 Sources: FRA, Railroad Safety Statistics Annual Report, 1997-2005, Table 1-1, 5-9. FRA Accident/Incident Bulletin, 1980-1996, Table 19, 36. AAR Analysis of FRA Train Accident Database through 2007. Note: Includes accidents due to locomotive truck component defects.
Grade crossing collisions have declined 74% since 1980 and 52% since 1990. 10,611 5,715 2,749 Sources: FRA, Railroad Safety Statistics Annual Report, 1997-2005, Table 1-1. FRA Highway/Rail Crossing Accident/Incident & Inventory Bulletin, 1980-1996, Table S. FRA website: http://safetydata.fra.dot.gov/Prelim/2007r01.htm (preliminary 2007 data) Notes: Includes collisions involving pedestrians. Includes collisions at private crossings.
Grade crossing fatalities have declined 59% since 1980 and 52% since 1990. 833 698 338 Sources: FRA, Railroad Safety Statistics Annual Report, 1997-2005, Tables 1-1, 1-3. FRA Highway/Rail Crossing Accident/Incident & Inventory Bulletin, 1980-1996, Table S. FRA website: http://safetydata.fra.dot.gov/Prelim/2007/r01.htm (preliminary 2007 data) Note: Includes pedestrians, employees, passengers, and collisions at private crossings.
Grade crossing injuries have declined73% since 1980 and 57% since 1990. 3,890 2,407 1,031 Sources: FRA, Railroad Safety Statistics Annual Report, 1997-2005, Tables 1-1, 1-3. FRA Highway/Rail Crossing Accident/Incident & Inventory Bulletin, 1980-1996, Table S. FRA website: http://safetydata.fra.dot.gov/Prelim/2007/r01.htm (preliminary 2007 data) Note: Includes pedestrians, employees, passengers, and collisions at private crossings.
Grade crossing collision rates have declined for 29 consecutive years, 77% since 1980 and 63% since 1990. Grade Crossing Collisions per Million Train-Miles 14.79 9.39 3.47 Sources: FRA, Railroad Safety Statistics Annual Report, 1997-2005, Table 1-1. FRA Highway/Rail Crossing Accident/Incident & Inventory Bulletin, 1980-1996, Table S. FRA website: http://safetydata.fra.dot.gov/Prelim/2007/r01.htm & r02.htm (preliminary 2007 data) Note: Includes accidents involving pedestrians and collisions at private crossings.
Since 1980, the total number of public crossings has declined 35%, while the number with gates has increased 146%. 35% Decrease Passive 75% Passive 54% Lights 17% Lights 17% Gates 29% Gates 8% Sources: AAR Analysis of December 2007 FRA Grade Crossing Inventory Database. FRA, Railroad Safety Statistics Annual Report 2005, Table 9-3. FRA Highway/Rail Crossing Accident/Incident & Inventory Bulletin, 1980, Table 46.
Grade crossing warning device upgrades work. Gates cut the accident & fatality rates by 93%. Grade Crossing Collisions per Billion Collision Opportunities 296 63 21 Source: AAR Analysis of FRA Grade Crossing Incident & Inventory Databases, using 1999-2003 incident data and the December 2003 inventory data. Note: Collision opportunities are measured here as the average number of trains per hour multiplied by the average number of vehicles per hour moving over each crossing. It is useful primarily as a measure of relative, not absolute, exposure, since the time period (hour) is arbitrary.
Grade crossing collisions are usually caused by motorist error. Stopped, Proceeded 6% Stopped on Tracks: 29% Did Not Stop 41% Other 8% Drove Around Gate: 16% Sources: AAR Analysis of Highway-Rail Incident Database for 2007 (July 2008). FRA, Railroad Safety Statistics Annual Report 2005, Table 8-6. Note: Motor vehicle highway-rail incidents at public crossings.
Trespasser fatalities continue to be a significant safety problem. 543 457 473 Sources: FRA, Railroad Safety Statistics Annual Report, 1997-2005, Tables 1-2, 10-3. FRA Accident/Incident Bulletin, 1980-1996, Table 13. FRA website: http://safetydata.fra.dot.gov/Prelim/2007/r03.htm (preliminary 2007 data) Note: Excludes "trespasser" fatalities at grade crossings.
But the trespasser fatality rate per million train miles was still the lowest in 25 years in 2005. 0.89 0.64 0.60 Sources: FRA, Railroad Safety Statistics Annual Report, 1997-2005, Tables 1-2, 10-3. FRA Accident/Incident Bulletin, 1980-1996, Table 13. FRA website: http://safetydata.fra.dot.gov/Prelim/2007/r03.htm (preliminary 2007 data) Note: Excludes "trespasser" fatalities at grade crossings.
85% of trespasser fatalities in 2007 resulted from being struck by trains or freight cars. Train Accidents 3 Other 71 Struck by On-Track Equipment 410 Source: AAR Analysis of FRA Casualty Database for 2007. FRA, RR Safety Statistics Annual Report 2005, Table 10-10. Note: Excludes "trespasser" fatalities at grade crossings.
Many Trespassers are Killed While Intoxicated. • A North Carolina study for the period 1990-1994 found that 78% of 128 trespassers killed on railroad property were intoxicated. The median blood alcohol level for this group was 2.5 times the legal limit. • A 1994 South Carolina study of 24 train-related pedestrian fatalities found that 79% were intoxicated. • Toxicology results on 78 of 132 railroad trespassers killed in Georgia in the period 1990-1996 found 40 (51%) with alcohol levels above 100 mg/dL. • A 2005 survey of coroners and Chief Medical Examiners found that alcohol and/or drugs were judged to be a factor in 530 (57%) of 929 trespasser fatalities in the period 2002-2004 for which the additional data could be obtained. Sources: Andrew Pelletier, MD, "Deaths Among Railroad Trespassers: The Role of Alcohol in Fatal Injuries,” Journal of the American Medical Association, Vol. 277, No. 13, April 2, 1997, pp. 1064-66. Center for Disease Control, Morbidity & Mortality Weekly Report, Vol. 48, No. 25, July 2, 1999. Bruce George, “Rail Trespasser Fatalities: Developing Demographic Profiles,” presentation to Transportation Research Board Annual Meeting, January 15, 2008.
Passengers are 15 to 20 times as likely to die on the highway as on a train. Passenger Fatalities per Billion Passenger Miles Highway Railroads Airlines Sources: BTS, U.S. Air Carrier Traffic Statistics, Domestic Sched & Unsched; NTSB, Aviation Accident Data Base; FHWA, Highway Statistics 2006, Table VM-1. NHTSA, Traffic Safety Facts 2006, Early Ed., Table 4, p. 18. FRA Accident/Incident Bulletin, Tables 13, 36; RR Safety Statistics Annual Report 2005, Tables 1-3, 2-9. Excludes 232 airline passenger fatalities in the Sept. 11, 2001 terrorist attacks.
Railroads and airlines have comparable passenger fatality rates. Passenger Fatalities per Billion Passenger Miles Railroads Airlines Sources: BTS, U.S. Air Carrier Traffic Statistics, Domestic Sched & Unsched; NTSB, Aviation Accident Data Base; FRA Accident/Incident Bulletin, Tables 13, 36; RR Safety Statistics Annual Report 2005, Tables 1-3, 2-9. Note: 1993 RR fatalities included 42 killed in one Amtrak accident caused by a barge hitting & misaligning a RR bridge and another 6 killed by a gunman on the Long Island RR. Excludes 232 fatalities in 9/11 attacks.
Railroads have reduced employee casualty rates by 80% since 1980 and 71% since 1990. Total Casualties per 100 Full-Time Employees 11.16 7.59 2.19 Sources: FRA, Railroad Safety Statistics Annual Report, 1997-2005, Tables 1-2, 4-1. FRA Accident/Incident Bulletin, 1980-1996, Tables 13, 36. FRA website: http://safetydata.fra.dot.gov/Prelim/2007/r01.htm & r02.htm (preliminary 2007 data) Note: Casualties include fatalities as well as injuries and occupational illnesses.
Railroads have lower employee injury rates than do other major industry groups. Lost Workday Injuries & Illnesses per 100 Full Time Employees, 2006 Source: Bureau of Labor Statistics, http://www.bls.gov/iif/oshwc/osh/os/ostb1765.pdf
Railroads have lower employee injury rates than do other transportation modes. Lost Workday Injuries & Illnesses per 100 Full Time Employees, 2006 Source: Bureau of Labor Statistics, http://www.bls.gov/iif/oshwc/osh/os/ostb1765.pdf
Railroads have lower employee fatality rates than do other transportation modes. Fatalities per 100,000 Full Time Employees, 2006 Sources: Bureau of Labor Statistics, National Census of Fatal Occupational Injuries, 2006, Table 2; And BLS Quarterly Census of Employment & Wages (QCEW) Program for number of employees. FRA website: http://safetydata.fra.dot.gov/Prelim/2006/r03.htm (preliminary 2006 data). FRA, Railroad Safety Statistics Annual Report 2005, Tables 1-1 and 1-2.
Railroads have about the same injury severityas do other industries. Percent of Lost Workday Employee Injuries, 2006 Source: Bureau of Labor Statistics, Table R49. Number of nonfatal occupational injuries and illnesses involving days away from work by nature of injury and industry division, 2006. http://www.bls.gov/iif/ oshwc/osh/case/ostb1841.pdf . AAR Analysis of FRA Casualty Database for 2006. See also FRA, Railroad Safety Statistics Annual Report 2005, Table 4-1.
Railroads have about the same injury severityas do other industries. Percent of Lost Workday Employee Injuries, 2006 (Sprains not shown) Source: Bureau of Labor Statistics, Table R49. Number of nonfatal occupational injuries and illnesses involving days away from work by nature of injury and industry division, 2006. http://www.bls.gov/iif/ oshwc/osh/case/ostb1841.pdf . AAR Analysis of FRA Casualty Database for 2006. See also FRA, Railroad Safety Statistics Annual Report 2005, Table 4-1.
U.S. railroads have had lower employee injury rates than have most major European railroads. Lost Workday Injuries per 100 Employees Spain Italy Belgium Austria France Norway BR Germany U.S. Britain Sweden Sources: UIC, Statistics on Accidents at Work, 1993-2001. FRA, Accident/Incident Bulletin, Tables 43, 45, 46. FRA, Railroad Safety Statistics Annual Reports, 1997-2001, Tables 4-1, 1-1. UIC discontinued these stats after 2001. Notes: Excludes occupational illnesses. Excludes injuries with no days away from work. Includes fatal injuries. Data for Sweden & Norway (1993-96) and for U.S. (all years) is per 200,000 hours actually worked, hence higher.
The safest U.S. RRs have had lower employee injury rates than have the safest European RRs. Lost Workday Injuries per 100 Employees Norway Sweden BR IC CSX UP BNSF NS Sources: UIC, Statistics on Accidents at Work, 1993-2001. FRA, Accident/Incident Bulletin, Tables 43, 45, 46. FRA, Railroad Safety Statistics Annual Reports, 1997-2001, Tables 4-1, 1-1. UIC discontinued these stats after 2001. Notes: Excludes occupational illnesses. Excludes injuries with no days away from work. Includes fatal injuries. Data for Sweden & Norway (1993-96) and for U.S. (all years) is per 200,000 hours actually worked, hence higher.
In 2007, train accidents and grade crossing collisions accounted for less than 4% of employee injuries. All Other Incidents 96.35% Train Accidents 1.71% Grade Crossing Collisions 1.94% Source: FRA website: http://safetydata.fra.dot.gov/Prelim/2007/r03.htm (preliminary 2007 data) See also FRA, Railroad Safety Statistics Annual Report 2005, Table 1-3.
Railroads have reduced employee fatalities by 82% since 1980 and 57% since 1990. 97 40 17 Sources: FRA, Railroad Safety Statistics Annual Report, 1997-2005, Tables 1-2, 1-3, 4-2. FRA Accident/Incident Bulletin, 1980-1996, Tables 13. Employee on Duty Fatalities. FRA website: http://safetydata.fra.dot.gov/Prelim/2007/r03.htm (preliminary 2007 data)
Railroads employee fatality rates have fallen 51% since 1990. Employee On-Duty Fatalities per 100,000 Employees 14.5 7.0 Sources: FRA, Railroad Safety Statistics Annual Report, 1997-2005, Tables 1-1, 4-2. FRA Accident/Incident Bulletin, 1980-1996, Tables 13, 36. FRA website: http://safetydata.fra.dot.gov/Prelim/2007/r03.htm & r02.htm (preliminary 2007 data)
Of 21 employee fatalities in 2007, 12 were due to being struck or crushed by moving on-track equipment. Transp, Struck by Train -1 MOW Struck by Train - 5 Switching, Struck Or Crushed By Cars or Locos. (“SOFA”)- 6 MOW – Other - 4 Grade Xing Collision - 1 Road Train Collision - 2 MOE – Electrocution - 1 MOE – Highway Accident - 1 Sources: News clippings and FRA, Monthly Reports on Employee Fatalities, 2007. FRA, Railroad Safety Statistics Annual Report, 1997-2005, Tables 1-2.
Of 16 employee fatalities in 2006, none occurred in trainaccidents, 4 occurred in grade crossing collisions, and 9 were due to being struck by moving on-track equipment. Transp Switching, Struck Or Crushed By Cars or Locos. (“SOFA”)- 5 MOW Struck by MOW Equip - 2 MOW In Hwy Accident - 1 Other – 1 Veh struck bldg. Transp in Grade Crossing Collision - 2 MOE Struck or Crushed by Frt Cars - 2 MOE in Veh Collision - 1 MOE in Grade Xing Collision - 2 Sources: News clippings and FRA, Monthly Reports on Employee Fatalities, 2006. FRA, Railroad Safety Statistics Annual Report, 1997-2005, Tables 1-2.
Of 25 employee fatalities in 2005, 11 were due to being struck or crushed by moving on-track equipment and 8 were in train or grade crossing collisions. Transportation, Not in Train Accident Switching, Struck Or Crushed By Cars or Locos. (“SOFA”)- 11 Road Train Collisions - 7 MOW Struck by Train - 2 Grade Xing Collision - 1 MOW In Hwy Accident - 2 Maint. of Way Transportation: Train Accident Explosion - 1 Electrocution - 1 Maint of Equip. Sources: News clippings and FRA, Monthly Reports on Employee Fatalities, 2005. FRA, Railroad Safety Statistics Annual Report, 1997-2005, Tables 1-2.
Hazmat accident rates have declined 87% since 1980 and 34% since 1990. Train Accidents with a Release per Thousand Hazmat Carloads 0.143 99.996% of Carloads are Accident Release Free 0.018 0.027 Sources: FRA, RR Safety Statistics Annual Report, 1997-2005, Table 6-1. FRA, Accident/Incident Bulletin, Table 26. AAR Analysis of 2006 FRA Train Accident Database. Carloads from ICC/STB Waybill Sample, 1995-2006. Terminated carloads adjusted to counter known hazmat underreporting. Prior to 2003 terminated carloads overestimated by 10% to 15% due to inability to exclude duplicates associated with rebilling.
Accidents with a hazmat release have declined 61% since 1980. Reportable Train Accidents with a Hazmat Release 119 46 35 Sources: FRA, RR Safety Statistics Annual Report, 1997-2005, Tables 6-1. FRA, Accident/Incident Bulletin, Table 26. AAR Analysis of 2007 FRA Train Accident Database. Note: An accident may involve releases from more than one car.
Hazmat incident release rates have declined 72% since 1980 and 58% since 1990. Incidents per Thousand Hazmat Carloads 1.52 0.99 0.42 99.96% Incident Free Sources: USDOT, Pipeline & Hazardous Materials Safety Administration, Hazardous Materials Incidents by Year & Mode. http://hazmat.dot.gov/files/hazmat/10year/10yearfrm.htm for 1997-2006. Includes releases in train accidents as well as non-accident releases. ICC/STB Waybill Sample. 1995-2006. Terminated carloads adjusted to counter known hazmat underreporting. Prior to 2003 terminated carloads overestimated by 10% to 15% due to inability to exclude duplicates associated with rebilling.
Over the last 10 years, about 1.1% of train accidents have resulted in a release of hazardous materials. No Hazmat Cars Present 23,715 75.5% Hazmat Cars in Consist 3,997 12.7% Hazmat Cars Derailed or Damaged 3,360 10.7% Hazmat Released 354 1.1% Source: AAR Analysis of 1998-2007 FRA Train Accident Databases, July 2008. Note: Includes grade crossing train accidents meeting dollar threshold.