Download
1 / 64
640 likes | 644 Views
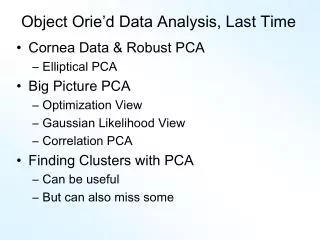
Object Orie’d Data Analysis, Last Time. Classification / Discrimination Classical Statistical Viewpoint FLD “good” GLR “better” Conclude always do GLR No longer true for HDLSS data GLR fails FLD gave strange effects. HDLSS Discrimination. Movie Through Increasing Dimensions.

E N D
Object Orie’d Data Analysis, Last Time Classification / Discrimination • Classical Statistical Viewpoint • FLD “good” • GLR “better” • Conclude always do GLR • No longer true for HDLSS data • GLR fails • FLD gave strange effects
HDLSS Discrimination Movie Through Increasing Dimensions
HDLSS Discrimination Simple Solution: Mean Difference (Centroid) Method • Recall not classically recommended • Usually no better than FLD • Sometimes worse • But avoids estimation of covariance • Means are very stable • Don’t feel HDLSS problem
HDLSS Discrimination Mean Difference (Centroid) Method Same Data, Movie over dim’s
HDLSS Discrimination Mean Difference (Centroid) Method • Far more stable over dimensions • Because is likelihood ratio solution (for known variance - Gaussians) • Doesn’t feel HDLSS boundary • Eventually becomes too good?!? Widening gap between clusters?!? • Careful: angle to optimal grows • So lose generalizability (since noise inc’s) HDLSS data present some odd effects…
Maximal Data Piling Strange FLD effect at HDLSS boundary: Data Piling: For each class, all data project to single value
Maximal Data Piling What is happening? • Hard to imagine • Since our intuition is 3-dim’al • Came from our ancestors… Try to understand data piling with some simple examples
Maximal Data Piling Simple example (Ahn & Marron 2005): in Let be the hyperplane: • Generated by Class +1 • Which has dimension = 1 • I.e. line containing the 2 points Similarly, let be the hyperplane • Generated by Class -1
Maximal Data Piling Simple example: in Let be • Parallel shifts of • So that they pass through the origin • Still have dimension 1 • But now are subspaces
Maximal Data Piling Simple example: in
Maximal Data Piling Simple example: in Construction 1: Let be • Subspace generated by • Two dimensional • Shown as cyan plane
Maximal Data Piling Simple example: in Construction 1 (cont.): Let be • Direction orthogonal to • One dimensional • Makes Class +1 Data project to one point • And Class -1 Data project to one point • Called Maximal Data Piling Direction
Maximal Data Piling Simple example: in Construction 2: Let be • Subspaces orthogonal to (respectively) • Projection collapses Class +1 • Projection collapses Class -1 • Both are 2-d (planes)
Maximal Data Piling Simple example: in Construction 2 (cont.): Let intersection of be • Same Maximal Data Piling Direction • Projection collapses both Class +1 and Class -1 • Intersection of 2-d (planes) is 1-d dir’n
Maximal Data Piling General Case: in with Let be • Hyperplanes generated by Classes • Of Dimensions (resp.) Let be • Parallel subspaces • I.e. shifts to origin • Of Dimensions (resp.)
Maximal Data Piling General Case: in with Let be • Orthogonal Hyperplanes • Of Dim’ns (resp.) • Where • Proj’n in Dir’ns Collapse Class +1 • Proj’n in Dir’ns Collapse Class -1 • Expect intersection
Maximal Data Piling General Case: in with Can show (Ahn & Marron 2005): • Most dir’ns in intersection collapse all to 0 • But there is a direction, • Where Classes collapse to different points • Unique in subspace generated by the data • Called Maximal Data Piling Direction
Maximal Data Piling Movie Through Increasing Dimensions
Maximal Data Piling MDP in Increasing Dimensions: • Sub HDLSS dimensions (d = 1-37): • Looks similar to FLD?!? • Reason for this? • At HDLSS Boundary (d = 38): • Again similar to FLD…
Maximal Data Piling FLD in Increasing Dimensions: • For HDLSS dimensions (d = 39-1000): • Always have data piling • Gap between grows for larger n • Even though noise increases? • Angle (gen’bility) first improves, d = 39–180 • Then worsens, d = 200-1000 • Eventually noise dominates • Trade-off is where gap near optimal diff’nce
Maximal Data Piling How to compute ? Can show (Ahn & Marron 2005): Recall FLD formula: Only difference is global vs. within class Covariance Estimates!
Maximal Data Piling Historical Note: • Discovery of MDP • Came from a programming error • Forgetting to use within class covariance • In FLD…
Maximal Data Piling Visual similarity of & ? Can show (Ahn & Marron 2005), for d < n: I.e. directions are the same! • How can this be? • Note lengths are different… • Study from transformation viewpoint
Maximal Data Piling Recall Transfo’ view of FLD:
Maximal Data Piling Include Corres- ponding MDP Transfo’: Both give Same Result!
Maximal Data Piling Details: FLD, sep’ing plane normal vector Within Class, PC1 PC2 Global, PC1 PC2
Maximal Data Piling Acknowledgement: • This viewpoint • I.e. insight into why FLD = MDP (for low dim’al data) • Suggested by Daniel Peña
Maximal Data Piling Fun e.g: rotate from PCA to MDP dir’ns
Maximal Data Piling MDP for other class labellings: • Always exists • Separation bigger for natural clusters • Could be used for clustering • Consider all directions • Find one that makes largest gap • Very hard optimization problem • Over 2n-2 possible directions
Maximal Data Piling A point of terminology (Ahn & Marron 2005): MDP is “maximal” in 2 senses: • # of data piled • Size of gap (within subspace gen’d by data)
Maximal Data Piling Recurring, over-arching, issue: HDLSS space is a weird place
Kernel Embedding Aizerman, Braverman and Rozoner (1964) • Motivating idea: Extend scope of linear discrimination, By adding nonlinear components to data (embedding in a higher dim’al space) • Better use of name: nonlinear discrimination?
Kernel Embedding Toy Examples: In 1d, linear separation splits the domain into only 2 parts
Kernel Embedding But in the “quadratic embedded domain”, linear separation can give 3 parts
Kernel Embedding But in the quadratic embedded domain Linear separation can give 3 parts • original data space lies in 1d manifold • very sparse region of • curvature of manifold gives: better linear separation • can have any 2 break points (2 points line)
Kernel Embedding Stronger effects for higher order polynomial embedding: E.g. for cubic, linear separation can give 4 parts (or fewer)
Kernel Embedding Stronger effects - high. ord. poly. embedding: • original space lies in 1-d manifold, even sparser in • higher d curvature gives: improved linear separation • can have any 3 break points (3 points plane)? • Note: relatively few “interesting separating planes”
Kernel Embedding General View: for original data matrix: add rows: i.e. embed in Higher Dimensional space
Kernel Embedding Embedded Fisher Linear Discrimination: Choose Class 1, for any when: in embedded space. • image of class boundaries in original space is nonlinear • allows more complicated class regions • Can also do Gaussian Lik. Rat. (or others) • Compute image by classifying points from original space
Kernel Embedding Visualization for Toy Examples: • Have Linear Disc. In Embedded Space • Study Effect in Original Data Space • Via Implied Nonlinear Regions Approach: • Use Test Set in Original Space (dense equally spaced grid) • Apply embedded discrimination Rule • Color Using the Result
Kernel Embedding Polynomial Embedding, Toy Example 1: Parallel Clouds
Kernel Embedding Polynomial Embedding, Toy Example 1: Parallel Clouds • PC 1: • always bad • finds “embedded greatest var.” only) • FLD: • stays good • GLR: • OK discrimination at data • but overfitting problems
Kernel Embedding Polynomial Embedding, Toy Example 2: Split X
Kernel Embedding Polynomial Embedding, Toy Example 2: Split X • FLD: • Rapidly improves with higher degree • GLR: • Always good • but never ellipse around blues…
Kernel Embedding Polynomial Embedding, Toy Example 3: Donut
Kernel Embedding Polynomial Embedding, Toy Example 3: Donut • FLD: • Poor fit for low degree • then good • no overfit • GLR: • Best with No Embed, • Square shape for overfitting?
Kernel Embedding Drawbacks to polynomial embedding: • too many extra terms create spurious structure • i.e. have “overfitting” • HDLSS problems typically get worse
Kernel Embedding Hot Topic Variation: “Kernel Machines” Idea: replace polynomials by other nonlinear functions e.g. 1: sigmoid functions from neural nets e.g. 2: radial basis functions Gaussian kernels Related to “kernel density estimation” (recall: smoothed histogram)
Kernel Density Estimation Chondrite Data: Represent points by red bars Where are data “more dense”?
Kernel Density Estimation Chondrite Data: Put probability mass 1/n at each point Smooth piece of “density”