Download
1 / 22
220 likes | 243 Views
Human population and its impact. Week Seven. Main Principles. We do not know how long we can continue increasing the earth’s carrying capacity for humans without seriously degrading the life-support system for human and many other species.

E N D
Human population and its impact Week Seven
Main Principles • We do not know how long we can continue increasing the earth’s carrying capacity for humans without seriously degrading the life-support system for human and many other species. • Population size increases because of births and immigration and decreases through deaths and emigration. • The average number of children born to women in a population (total fertility rate) is the key factor that determines population size. • The numbers of males and females in young, middle, and older age groups determine how fast a population grows or declines. • Experience indicates that the most effective ways to slow human population growth are to encourage family planning, to reduce poverty, and to elevate the status of women.
Facts on human population Before agricultural era (10000 years ago) HP was about 5 millions. Till the industrial revelation the Earth population was near to 250 M. before the exponential age (200 yeas ago). Form the beginning of story till 1927 HP got its first 2 Billion. Less than 50 years needed to add the next 2 B (1927-1974). Just 25 years to add the next 2 B (1974-1999). In 2012 we are 7 Billion. In 2008 there were 6.7 B, in 2050 there will probably be 9.3 and 2100 almost 10 Billion population in the Earth.
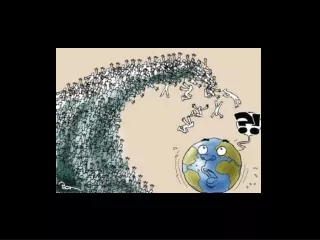
Living in an exponential age Exponential growth: a quantity increase at a fixed percentage per unit of time. It is deceptive and starts slowly, while it grows to enormous number because each doubling is more the total of all earlier growth. In beginning of 20th century the population size was about 1 Billion, it is increase exponentially till 1963 which was started to decline. Even so, each day we add an average of 225000 more people to the earth, almost a new France every 9 months and a new US every 4 years. Actual rate of global population growth is 1.22% a year and still exponentially. 82% of the world population living in developing countries. But in developed ones resource consumption per capita rate is very high. Almost 1B live in countries with essentially stable population size while another 1B live in countries whose population project to at least double till 2050.
Living in an exponential age In 2008 almost 82 M added to the world population, 1.2 M in developed and 80.8 M in developing countries. The rate of population growth (PG) in 2008 in developed countries is 0.1% and the same rate in developing countries is growing 15 time faster at 1.5% a year. World population in 2050 with high projection is 10.8 with low is 7.8 and with medium projection is 9.3 B. 97% of PG will take place in developing countries, where acute poverty is a way of life for about 1.4 B people.
What are the effects Irreversible loss of 1/3 to ½ of the world flora and fauna; Burning carbon- based fuels and clearing forests changes the climate; Ruin some areas for farming; Shift water supplies; Eliminate many of the earth’s unique form of life; Disrupt economies in various parts of the world.
Cons & Pros on Population Growth • Cons: • The carrying capacity of the Earth is not enough to provide basic necessities for about 1.4 B. (1/5 of earth population). How we can offer it to projected 2.6 B more in 2050. • The two immediate consequences of no decrease of population are 1) death rates may increase in some areas due to declining health and environmental conditions. 2) resource use and environmental degradation may intensify by large EP.
Cons & Pros on Population Growth • Proponents: • Technological advances have allowed us to overcome the environmental restrains. • The carrying capacity of our planet has no limitation so far. It can support billions of our species and in fact population growth is valuable resource for solving environmental problems and stimulating economic growth and consumption. • Population regulation is a violation of religious and moral believes and bridge of privacy and freedom.
HP and Degradation of Natural Capital • Our activities effects 83% of the earth’s land surface excluding Antarctica as our Ecological Footprints (EF) spread across the globe. • HP degrades various component of the earth’s biodiversity (Natural Capital) mainly by: • Reduction of Biodiversity • Increasing use of the earth’s net primary productivity • Increasing of genetic resistance of pest species and bacteria • Elimination of many natural predators • Introduction of potentially harmful species to the communities • Using renewable resources faster than they can be replaced • Interfering with earth’s chemical and energy cycling processes • Relying mostly on polluting and climate – changing fossil fuels
Theory of optimum sustainable population This theory believes that the question of “How many people can the earth support indefinitely?” is a wrong one. It believes on the “No population can continue growing indefinitely” (one of the four scientific principal of sustainability) The theory of “optimum sustainable population” is based on the planet’s Cultural Carrying Capacity. Cultural Carrying Capacity is an optimum level that could allow most people to live in reasonable comfort and freedom without impairing the ability of the planet to sustain future generations.
Major Factors for population increase I) human developed the ability to expand into diverse new habitats and different climate zones. II) the emergence of early and modern agriculture allowed more people to be fed for each unit of land area farmed. III) the development of sanitation system, antibiotics, and vaccines helped control of infectious disease agents.
Population change • Population change depends on interplaying of three factors: • Births or fertility • Deaths or mortality • migration Population change = (Births +Immigration)- (Deaths +Emigration) • Birth rate or crude birth rate is the number of live births per 1000 people in population in a given year • Death rate or crude death rate is the number of deaths per 1000 people in population in a given year
Fertility rate and PG Fertility rate is the number of children born to a woman during her lifetime. Two type of fertility rate affect PG rate: I) Replacement – level fertility rate: is the average number of children that couple in a population must bear to replace themselves. It is 2.1 children per couple. (2.1 developed and 2.5 developing countries) . It is not bringing immediate halt to PG and works within next 50 years. II) Total fertility rate (TFR): is the average number of children born to women in population during their reproductive years . It plays an important role in PG. 2008 global TFR was 2.6 children per women, 1.6 in developed (from2.5 in 1950) and 2.8 in developing countries (from 6.5 in 1950) but should be 2.1 globally.
Factors affect Birth Rates and TFR Importance of the children as a part of the labor force The cost of raising and educating children (290000$ in US) The availability of private and public pension systems Urbanization and having better access to family planning services Educational and employment opportunities available for women Infant mortality rate Average age of marriage Availability of legal abortions ( out of 190m annual pregnancy 46m abortions happened, 29m legal & 20 not) Availability of reliable birth control methods Religious beliefs, traditions, and cultural norms
Factors affect Death Rates • Increased food supplies and distribution • Better nutrition • Medical advances including immunization and antibiotics • Improved sanitation • Safer water supplies All these factors resulted in: • Longer life expectancy: the average number of years a newborn infant can expect to live • Global life expectancy increased from 48 to 68 years (1955-2008), 77 years in developed and 67 in developing countries and projected to be 74 years by 2050 • Reduction on infant mortality rate: the number of babies out of every 1000 born who die before their first birthday • World’s infant mortality rate dropped from 20 to 6.3 in developed countries (1965-2008) and from 118 to59 in developing countries
Factors affect Migration Seeking jobs Economic improvement Religious persecution Ethnic conflicts and wars Political oppression Environmental degradation (2005 environmental refugees reached 25m and in 2020 may reach to 50m)
Age structure • Age structure: the distribution of males and females among age groups in the population . • Age structure diagram is constructed by plotting the percentages or numbers of males and females in the total population in each three age categories which are: • Pre reproductive age (0-14) • Reproductive age (15-44) • Post productive age (45 and older) • Population with younger than age 15 has a powerful built-in momentum to increase its population size. • Nearly 28% (1.9B) of the world planet is younger than 15 (30% in developing and 17% in developed countries)
Age structure information & Population and Economic Projection AS has long lasting economic and social impacts Effects labor markets Income generation, Health care issues Social security migration Political implications
Human Population Growth models Demographic transition theory Family planning Empowering women
Demographic transition theory • Demographic transition theory: as countries become industrialized, first their death rates and then their birth rates decline. This transition takes place in four stage including: • Preindustrial; PG is slow, BR high, DR high • Transitional; PG is high, BR high, DR low • Industrial; PG is slow, BR dropped, DR dropped • Post industrial; PG is stable and than decline, BR equal and then fall bellow DR
Family planning Family planning provides educational and clinical services that help couples choose how many children to have and when to have them. It contains birth spacing, birth control, and health care for mothers and infants. It helps to drop 55% of TFRs in developing countries (from 6 to 3 in 1960 to 2008)
Empowering women • Women with: • I) sufficient education • II) hold a paying job • III) live in society with observing human rights tend to have fewer children • Main cause of women poverty (ThoryaObaid ED of UN population found): • Illiteracy • Poor health • Unwanted high fertility These contribute to environmental degradation and increase poverty