Download
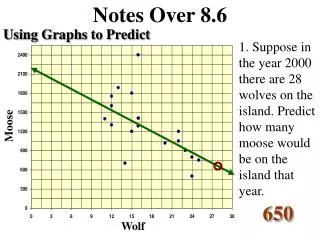
1 / 15
150 likes | 212 Views
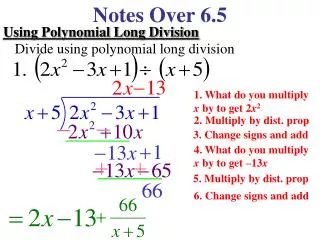
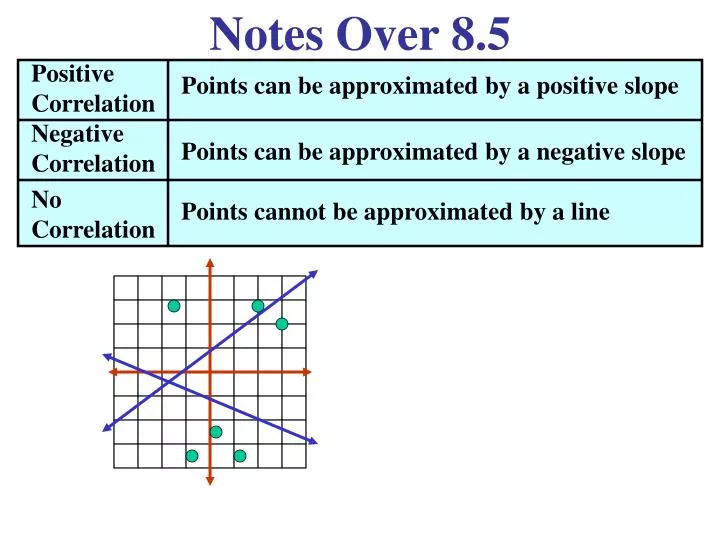
Notes Over 8.5. Positive Correlation. Points can be approximated by a positive slope. Negative Correlation. Points can be approximated by a negative slope. No Correlation. Points cannot be approximated by a line. Notes Over 8.5. Scatter Plots.

E N D
Notes Over 8.5 Positive Correlation Points can be approximated by a positive slope Negative Correlation Points can be approximated by a negative slope No Correlation Points cannot be approximated by a line
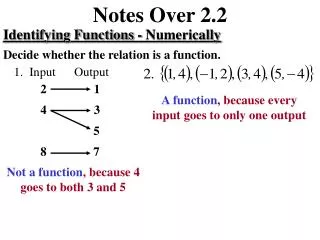
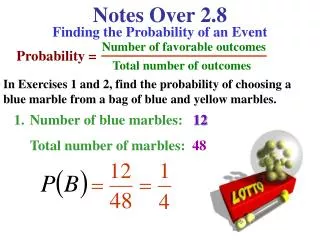
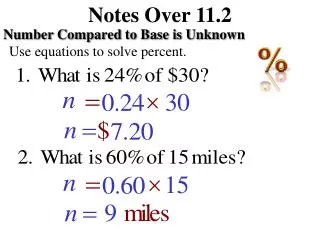
Notes Over 8.5 Scatter Plots 1. Describe the person represented by point B. $90,000 a year 14 years education
Notes Over 8.5 Scatter Plots 3 2. How many people have 14 years of education? $50,000; $80,000; $90,000 What are their incomes?
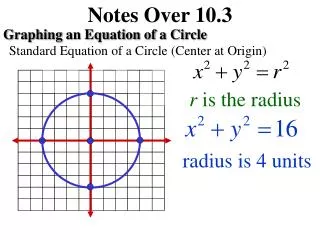
Notes Over 8.5 Scatter Plots 3. Describe the relationship between years of education completed and income. More years means more money
Notes Over 8.5 Scatter Plots 4. What kind of correlation does this graph have? Positive
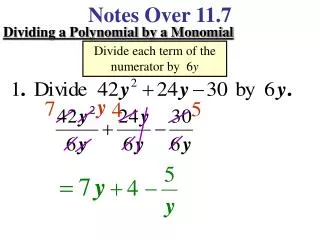
Notes Over 8.5 5. Make a scatter plot of the following data. 60 50 40 30 20 10 10 20 30 40 50 60
Notes Over 8.5 5. Make a scatter plot of the following data. 60 50 40 30 20 10 6. What kind of correlation does this graph have? None 10 20 30 40 50 60
Pg 412 8 – 5 #1 – 6, 7 – 21 The following scatter plot shows the average time a fifteen students spent watching television and the average time they spent on physical activity in a day. Physical Activity Television
Pg 412 8 – 5 #1 – 6, 7 – 21 1. Describe the student represented by point A. 2 hr Physical Activity 4 hr television Physical Activity Television
Pg 412 8 – 5 #1 – 6, 7 – 21 2. How many students had one hour of physical activity or less? 8 students Physical Activity Television
Pg 412 8 – 5 #1 – 6, 7 – 21 3. How many students spent four or more hours watching television? 6 students Physical Activity Television
Pg 412 8 – 5 #1 – 6, 7 – 21 Is there a positive correlation, a negative correlation, or no correlation between the set of data in each scatter plot? 4. No Correlation 0
Pg 412 8 – 5 #1 – 6, 7 – 21 Is there a positive correlation, a negative correlation, or no correlation between the set of data in each scatter plot? 5. Positive Correlation 0
Pg 412 8 – 5 #1 – 6, 7 – 21 Is there a positive correlation, a negative correlation, or no correlation between the set of data in each scatter plot? 5. Negative Correlation 0