Download
1 / 31
310 likes | 312 Views
This article highlights the urgent need for resource efficiency, the low awareness and adoption of it, and the potential for significant cost savings. It discusses the Enworks experience, the role of delivery models, support scope, and metrics used in increasing resource efficiency in business. It also includes an independent review of recent projects and the challenges involved in changing perceptions about efficiency.

E N D
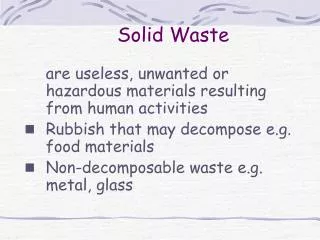
It’s not sexy but it works: Reaching the top of the waste hierarchy without breaking the bank
Content • Urgent call to action due to significant market failure • Awareness and adoption of resource efficiency is low • Efficiency is difficult to picture, just not sexy • But it is possible • ENWORKS experience • Role of the model of delivery, the scope of support and the metrics used in increasing resource efficiency in business • Independent review of recent projects • Discussion…
Market Failure – NW Business Survey • Only 26% have heard the term resource efficiency • 80% think resource efficiency is important to their business • Just 33% have taken action to increase their resource efficiency • ~30% turned off lights, changed bulbs, increased recycling • ~75% anticipate no return on investment • Only 20% plan future improvements in resource efficiency • 71% have not looked for support • Common perception is that new equipment & capital investment is always necessary… Efficiency is under-rated
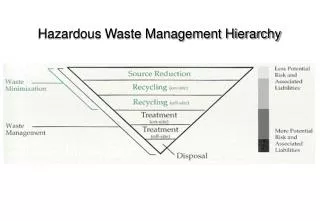
Residual Waste Management Process Improvements Eco Design “I need a compactor” “I need a new bit of kit” “I need an R&D project” Challenging perceptions on Efficiency
Challenging perceptions on Efficiency • £100 million annual savings identified • £27 million of these are achieved • 92% are achieved through a reduction in resource use • 72% of opportunities achieved with no capital cost • 58% of cost savings achieved with no capital cost • Of those achieved with capital cost… • 57% have payback period less than 1 year • 75% have payback period less than 2 years
Contributing factors • Model of delivery • Scope of support • Triage system • Metrics
Model of Delivery • Regional programme • All business sizes eligible • All sectors eligible • Removes barriers to engagement • Collaborate regionally & nationally • Ongoing support where appropriate • Act in the interests of the business…
Wide Scope • Eco design of products and packaging • On site facilitation / change management • On site technical advice • Monitoring & measurement • Research, options analysis • Audit / review of practices • Opportunity identification & quantification • Training & networking • Information provision & signposting • Referrals to other support • Sustainable procurement • Business continuity / risk • Biodiversity • Staff / community engagement • Legal compliance • Environmental policies • Customer demands
Wide scope • Energy efficiency • Material efficiency • Water efficiency • Residual waste management • Process efficiency • Eco design • Knowledge and skills transfer • Tools, information, equipment • Facilitation & technical advice • Difficult to describe the offer • Can maximise opportunities available
TRIAGE Targeting support • No barriers to light touch support • Nature, duration and depth of support determined by triage • Criteria must be flexible • Multiple interactions may be needed to obtain sufficient information to make the assessment
Metrics • Public funding = lots of measures • Important to maintain focus on key objectives • Target outcomes not process metrics • Activity is driven by the metrics employed
Using metrics to focus activity • Targeting our delivery partners to help businesses make: • Cost savings (£) through: • increasing energy efficiency (CO2) • reducing material consumption (tonnes) • reducing water consumption (m3) • diverting waste from landfill (tonnes)
The effects of other metrics on activity and impact Target = number of businesses advised Activity = light touch, one off interventions training events, basic site visit no triage Impact = difficult to measure likely to be minimal
The effects of other metrics on activity and impact Target = jobs and sales Activity = ‘Corporate Responsibility’ support environmental policy, legal compliance Impact = little or no efficiency savings
If Metrics = Saved £, CO2, materials, water If Metrics = Created Jobs & Sales • Eco design of products and packaging • On site facilitation / change management • On site technical advice • Monitoring & measurement • Research, options analysis • Audit / review of practices • Opportunity identification & quantification • Sustainable procurement • Business continuity / risk • Legal compliance • Environmental policies • Customer demands
ENWORKS Innovation Projects • 7 projects, 2009-2010, ~£650k • Examining different models & scope of delivery • Aim to identify key success factors for future activity • Independent review - Arup
ENWORKS Innovation Projects - Results • £5+ million annual cost savings identified • of which £625,000 is achieved • 400 tonnes CO2 savings • 6,000 tonnes material savings • 50,000 m3 water savings
Innovation Projects – Results of Procurement (7 Innovation Projects)
(1) Sector Focused Supply Chain Lessons Guard against design stage assumptions concerning the effectiveness of “representative” sector bodies in securing recruits – Optimism bias Importance of the strategic firms in motivating participation down the supply chain Effect of change in a firm’s mid course leadership Allow sufficient time to convert identified opportunities into outcomes Globalisation of supply chains in the NW may mean that many links in the chain are “out of area” yet these may be key drivers for resource use
(2) Generic supply chain - Lessons Screening out low resource intensive firms especially in the service sector (drag on effectiveness) Differentiate between the level of leadership available through the top tier (quality of management systems/ knowledge can vary) Spatial mapping of likely beneficiaries may be necessary to verify eligibility Importance of leadership from top tier to drive participation down the tiers Harmonised measurement approach Be prepared to move away from initial target companies
(3) Strategic Single Firm Allow sufficient lead time for getting initial corporate “buy in”; converting pipeline opportunities (e.g. capital approval processes, etc). Complex approval processes and systems to navigate Potential high yield resource savings if prepared to wait
(4) Single Solution Focus Benefit of a clear focus Supply push model Relatively low unit cost of outputs achieved Recruitment constraints less significant but still there Outcomes per unit output are relatively smaller Spillover opportunities less easy to include if outside the scope of whatever the “single solution” happens to be e.g. energy efficiency on a renewables brokering project Strategic focus less evident
(5) Lean “Green” Alignment - Issues Lean principles should create compatible drivers within firms that encourage resource efficiency but a “green” outcome can not be assumed from a lean activity Lean interventions can lead to non green outcomes especially in relation to the treatment/ management of inventory where decreased inventory is made at the expense of more transport resource consumption leading to more carbon use Need to have clear methodologies and specific material resource measurement
Eco Design innovation project • 12 businesses supported across 7 sectors • 4 product specification / redesign projects • 8 packaging improvement projects • £1+ million annual cost savings identified • £42k achieved • Less than 1 year payback • 6,000+ tonnes of material savings from 2 opportunities • 2 case studies
Pushing businesses up the waste hierarchy • Accepting market failure • Challenging perceptions • Demonstrating that efficiency is achievable and delivers significant benefits • Understanding the influence of delivery model, scope of support and metrics on activity and ultimately outcomes • Getting the balance right