Download
1 / 19
190 likes | 275 Views
Handling Attrition and Non-response in the 1970 British Cohort Study. Tarek Mostafa Institute of Education – University of London. Challenges to Longitudinal Surveys. Statistical analyses face a number of challenges: Unit non-response. Item non-response.

E N D
Handling Attrition and Non-response in the 1970 British Cohort Study Tarek Mostafa Institute of Education – University of London
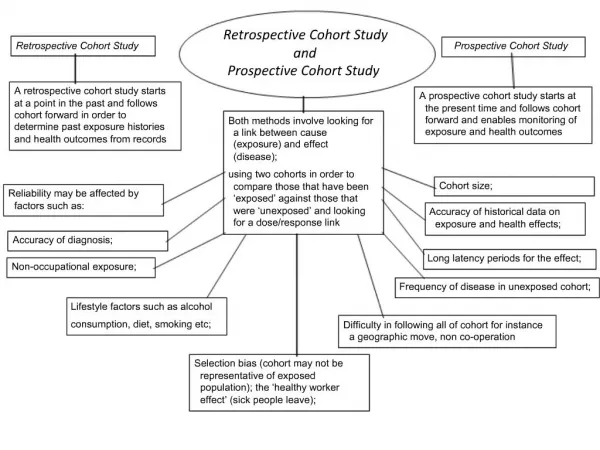
Challenges to Longitudinal Surveys Statistical analyses face a number of challenges: Unit non-response. Item non-response. Attrition over time in longitudinal surveys. Bias caused by missing data when missingness is not MCAR. Aim of the paper: Examine non-response in the 1970 British Cohort Study (BCS70) and explore the use of non-response weights and imputation to deal with attrition and item missingness 2
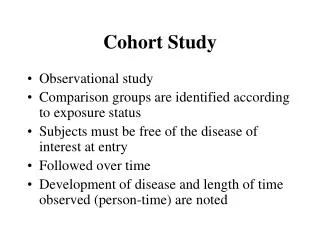
British Cohort Study 1970 BCS70 follows the lives of 17,000 people born in a single week in April 1970. Individuals were surveyed at birth and then at age 5, 10, 16, 26, 30, 34 and 38. The most recent wave at age 42 will be made available soon. BCS70 collects data on health, physical, educational and social development, and economic circumstances among other factors. 3
How effective are weights and imputations. Two approached are used to deal with attrition and item non-response: Attrition and non-response weights. Imputation techniques. Attrition weights: weak predictive power, no solution to item missingness, constructed using restrictive models, reduction in sample size especially when using data from different waves. Imputations: Treatment of both unit and item non-response, can be tailored according to the need of the researcher. Both techniques require knowledge of the process behind missingness. 11
Simulation Study Use a substantive model with Dependent variable: literacy scores at age 16 Independent variables: gender, age 10 gross family income per week (wave 3) and highest parental qualification (wave 4). Simulation: 1- construct inverse probability weights for wave 4. These weights will adjust for attrition in wave 4. 2- On literacy scores, introduce 10% missing values completely at random. 3- We recode the father’s social class into a binary variable with two categories Manual and non-manual. 4- On income and highest qualification, we introduce 40% missing values if the father’s social class is manual and 10% if it is non-manual. 5- We don’t introduce any missing values on gender. 12
Simulation Study A: BCS70 sample size at wave 1. B: BCS70 sample size at wave 4. C: Sample with complete cases given the substantive model. D: Simulation sample after the introduction of missing values. 13
Models to estimate Model 1: is estimated using the sample with complete cases (C) with non-response weights to adjust for the bias resulting from unit non-response (A-B). Model 2: is estimated with the sample with complete cases (C) but without applying the non-response weights. Model 3: is estimated using the simulation sample (D) with listwise deletion. Model 4: is estimated using the simulation sample (D) with unit non-response weights. Model 5: is estimated using 20 imputed datasets that restore the sample size back to (C). Model 6: is the most complete model and is estimated using 20 imputed datasets that restore the sample size back to (C) in conjunction with unit non-response weights. 14
Results 15
Results 16
Conclusions Men from lower social backgrounds and with less educated parents are less likely to respond. The predictive power of the models is weak. Non-response weights don’t improve the estimates or their standard errors by much when data loss is due to item missingness. random multiple imputations are efficient in reducing the bias resulting from item missingness both in terms of estimates and standard errors with some exceptions. The efficacy of weights and imputations in dealing with bias resulting from unit non-response and item missingness depends on the extent of bias and whether variables correlated with the probability of unit and item non-response can be found.
Implications 18
Thank you for your attention Institute of Education University of London 20 Bedford Way London WC1H 0AL Tel +44 (0)20 7612 6881 Fax +44 (0)20 7612 6126 Email info@ioe.ac.uk Web www.ioe.ac.uk 19