Download
1 / 21
210 likes | 281 Views
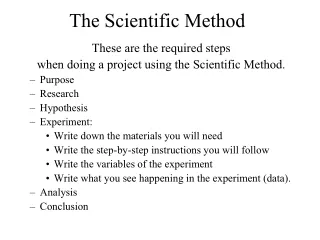
The Scientific Method. A review. What is the ``scientific method''? Organized common sense! 1. Make observations . 2. Invent a tentative description , called a hypothesis , that is consistent with what you have observed. 3. Design an experiment to test the hypothesis.

E N D
The Scientific Method A review
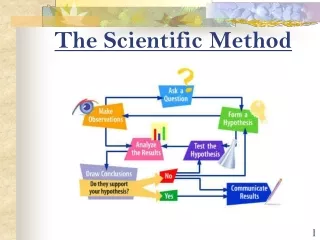
What is the ``scientific method''? • Organized common sense! • 1. Makeobservations. • 2. Invent a tentative description, called a hypothesis, that is consistent with what you have observed. • 3. Design an experiment to test the hypothesis. • 4.Collect Data, Analyze • 5.Conclusions : what you learned from the experiment • 6. Repeat/Retest : multiple trials are necessary
Simplified … • Make observations (vs inference) • Write testable hypothesis • Design experiment (dependent/ind. variables) • Collect data (qualitative vs quantitative) • Graph and analyze results
Observations • OBSERVATION: The use of senses to see and record the world around you. • INFERENCE: Making a conclusion based on opinion or prior experience.
Hypothesis • A statement that attempts to answer the experimental question. • No longer referred to as an ‘educated guess’; instead, it is a proposed solution. • Hypothesis must be TESTABLE.
Are these good hypotheses? • Fresh-water fish taste better. • The more expensive a perfume is, the better it smells. • Crocodiles in the Amazon Rain Forest have higher reproduction rates than those in the Florida Everglades. • Red cars have a higher resale value than cars of other colors.
Dependent vs. Independent Variables • Independent Variables—You control or change; aka “manipulated” variable. • Dependent Variable—You cannot control; aka “responding” variable. • Dependent Variable depends on the independent variable. You measure the dependent variables • All other factors are held constant (not changed)
Identify the variables. • The amount of cracking and peeling in paint was measured at different temperatures. • Mice bite each other more frequently when they are crowded in the cage. • The number of letters recognized on an eye chart is determined by how far away the chart is. • Ropes of different diameters will hold different amounts of weight before breaking. • Lemon trees receiving the most water produce the largest lemons.
Data Table Construction • Organize important categories of information into columns. • Label columns using appropriate units. • Title should reflect contents of data table.
Collecting data • quaLitative data = color, texture, odor, etc. • quaNtitative data = Numeric information (49o F 6.8 grams 1,479,930,110 meters) • Scientific notation is used to manage very large or very small numbers.
Accuracy vs Precision • Accuracy: how close a number is to what it should be. • Data points close together, but incorrect = high precision, low accuracy • Precision: degree of perfection or repeatability • Data points accurate, but widely ranging = high accuracy, low precision
Organize data into graphs, tables. Pie chart: • Useful for showing parts of a whole • Parts are labeled as % so whole circle = 100%.
Bar graphs • Often used to show how a quantity varies with factors such as time, location, or temperature • Relative heights of the bars show how the quantity varies
Line Graphs • The points on a line graph represent the intersection of data for 2 variables: • the independent and • the dependent variable • Remember “DRY MIX” • The Dependent (aka Responding) variable is on the Y axis. • The Manipulated (aka Independent) variable is on the X axis.