Download
1 / 34
340 likes | 349 Views
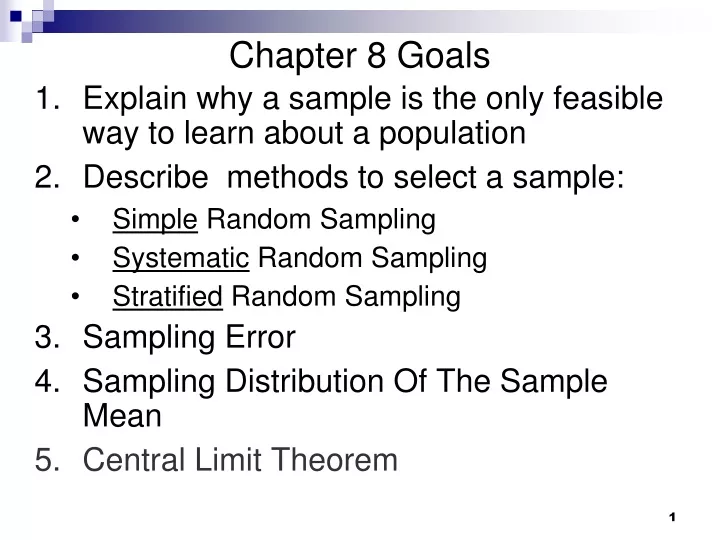
Chapter 8 Goals. Explain why a sample is the only feasible way to learn about a population Describe methods to select a sample: Simple Random Sampling Systematic Random Sampling Stratified Random Sampling Sampling Error Sampling Distribution Of The Sample Mean Central Limit Theorem.

E N D
Chapter 8 Goals • Explain why a sample is the only feasible way to learn about a population • Describe methods to select a sample: • Simple Random Sampling • Systematic Random Sampling • Stratified Random Sampling • Sampling Error • Sampling Distribution Of The Sample Mean • Central Limit Theorem
So Far, & The Future… Chapter 2-4 • Descriptive statistics about something that has already happened: • Frequency distributions, charts, measures of central tendency, dispersion Chapter 5, 6, 7 • Probability: • Probability Rules • Probability Distributions • Probability distributions encompass all possible outcomes of an experiment and the probability associated with each outcome • We use probability distributions to evaluate something that might occur in the future • Discrete Probability Distributions : • Binomial • Continuous Probability Distributions: • Standard Normal
So Far, & The Future… Chapter 8 • Inferential statistics: determine something about a population based only on the sample • Sampling • A tool used to infer something about the population • Talk about 3 probability sampling methods • Construct a Distribution Of The Sample Mean • Sample means tend to cluster around the population mean • Central Limit Theorem • Shape of the Distribution Of The Sample Mean tends to follow the normal probability distribution
A Sample Is The Only Feasible Way To Learn About A Population • The physical impossibility of checking all items in the population • Example: • Can’t count all the fish in the ocean • The cost of studying all the items in a population • Example: • General Mills hires firm to test a new cereal: • Sample test: cost ≈ $40,000 • Population test: cost ≈ $1,000,000,000
A Sample Is The Only Feasible Way To Learn About A Population • Contacting the whole population would often be time-consuming • Political polls can be completed in one or two days • Polling all the USA voters would take nearly 200 years! • The destructive nature of certain tests • Examples: • Film from Kodak • Seeds from Burpee
A Sample Is The Only Feasible Way To Learn About A Population • The sample results are usually adequate • It is more than likely that the additional accuracy of testing the whole population would not add a significant amount of improvement to the sample results • Example: • Consumer price index constructed from a sample is an excellent estimate for a consumer price index that could be constructed from the population
Probability Sampling • A sample selected in such a way that each item or person in the population has a known (nonzero) likelihood of being included in the sample • Known chance of being selected
Probability Sampling • Some of the methods used to select a sample: • Simple Random Sampling • Systematic Random Sampling • Stratified Random Sampling • There is no “best” method of selecting a probability sample from a population of interest • There are entire books devoted to sampling theory and design
NonprobabilitySample • In nonprobability sampling, inclusion in the sample is based on the judgment of the person selecting the sample • Nonprobability sampling can lead to biased results
Simple Random Sampling • A sample selected so that each item or person in the population has the same chance of being included • Example: • Names of classmates in a hat, mix up names, select until sample size, “n” is reached • Using a table of random numbers to select a sample from a population • Appendix
Using A Table Of Random Variables To Prevent Bias In Selecting A Sample To Represent A Population: • Example: • Here at Highline, select 50 students at random to fill out questionnaire about tenured faculty performance • Steps: • Use last four numbers of student ID • Select random method to select starting point in random number table • Close eyes and point • Month/day • Use first four numbers in table and match to last four in student ID • If first four numbers in table do not match, move to next • This will give us a list of students that will constitute a sample with size 50
Select 50 Students At Random • If you encounter one that is in the table, but there is no corresponding student id, skip it
Systematic Random Sampling: • The items or individuals of the population are arranged in some order • Invoice number • Date • Alphabetically • Social security number • A random starting point is selected and then every kth member of the population is selected for the sample • By starting randomly, all items have the same likelihood of being selected for the sample • Example: Audit Invoices for accuracy, start with 43rd invoice and select every 20th invoice and check for accuracy • This method should not be used if there is a pattern to the population, or else you could get biased sample • Example
Under Certain Conditions A Systematic Sample May Produce Biased Results • Inventory Count Problem: • Stacked bins with faster moving parts at the bottom • Start with 1st bin and count inventory for accuracy in every 3rd bin (may result in biased sample) • Simple random sampling would be better for this situation
Stratified Random Sampling • A population is first divided into subgroups, called strata, and a sample is selected from each stratum • Advantage of stratified random sampling: • Guarantees representation from each subgroup
Cluster Sampling • First: • A population is divided into primary units • Second: • Primary units are selected at random (not all primary units will be selected) • Third: • Samples are selected from the primary units • Employed to reduce the cost of sampling a population scattered over a large geographic area • Textbook shows geographic picture
Sampling Error • Will the mean of a sample always be equal to the population mean? • No! • There will usually be some error: • The difference between a sample statistic and its corresponding population parameter • Examples: • Xbar – μ • s – σ
Sampling Error • These sampling errors are due to chance • The size of the error will vary from one sample to the next • So how can we make accurate predictions based on samples??? • Answer: • Sampling Distribution Of The Sample Meanand • The Central Limit Theorem
Sampling Distribution Of The Sample Mean • A probability distribution of all possible sample means of a given sample size • Take a bunch of samples from the same population • Calculate the mean for each and plot all the means
Construct Sampling Distribution Of Sample Mean • Take many random samples of size “n” from a large population • Calculate the mean for each sample • Plot all means on graph (frequency polygon) • You would see that the curve looks normal! • Textbook has good example • In particular: • It shows how even if the population yields a skewed probability distribution, the distribution of sample means will be approximately normal • Population mean = mean of the distribution of the sample mean
Plot Distribution Of The Sample Mean (Approximately Normal) In Class Construction Of Distribution of Sample Means And Prove that µ = µbar Sampling Distribution Of The Sample Mean
Central Limit Theorem • If all samples of a particular size are selected from any population, the sampling distribution of the sample mean is approximately a normal distribution. This approximation improves with larger samples • If population distribution is symmetrical but not normal, the distribution will converge toward normal when n > 10 • Skewed or thick-tailed distributions converge toward normal when n > 30 • Look at picture on page 265
Central Limit Theorem • We can reason about the distribution of the sample mean with absolutely no information about the shape of the original distribution from which the sample is taken • The central limit theorem is true for all distributions • Central Limit Theorem will help us with: • Chapter 9 • Confidence intervals • Chapter 10 • Tests of Hypothesis
Mean Of The Distribution Of The Sample Mean • If we are able to select all possible samples of a particular size from a given population, then the mean of the distribution of the sample mean will exactly equal the population mean: • Even if we do not select all possible samples, they will be approximately equal:
Standard Deviation Of The Sampling Distribution Of The Sample Mean(Standard Error Of The Mean) • There is less dispersion in the sampling distribution of the sample mean than in the population (each value is an average!!) • σ = population standard deviation • n = sample size • When we increase “n” the standard deviation of the sample will decrease
Central Limit Theorem • Use the Central Limit Theorem to find probabilities of selecting possible sample means from a specified population • If the population is known to follow a normal distribution, or, n > 30… • We need our z-scores…
Z-Scores • To determine the probability a sample mean falls within a particular region, use: Sampling error Standard error of sampling distribution of the sample mean We are interested in the distribution Xbar, the sample mean, instead of X
Business Decisions Example 1 • History for a food manufacturer shows the weight for a Chocolate Covered Sugar Bombs (popular breakfast cereal) is: • μ = 14 oz. • σ = .4 oz. • If the morning shift sample shows: • Xbar = 14.14 oz. • n = 30 • Is this sampling error reasonable, or do we need to shut down the filling operations?
Business Decisions Example 1 Table shows an area of .4726 .5 - .4726 = .0274 It is unlikely that we could sample and get this weight, so we must investigate the box filling equipment In the distribution of sampling means, it is unlikely of getting a sample with 14.14 oz.
Suppose the mean selling price of a gallon of gasoline in the United States is $1.30. (μ) Further, assume the distribution is positively skewed, with a standard deviation of $0.28 (sigma). What is the probability of selecting a sample of 35 gasoline stations (n = 35) and finding the sample mean within $.08?
Step One : Find the z-values corresponding to $1.22 and $1.38. These are the two points within $0.08 of the population mean.
Step Two: determine the probability of a z-value between -1.69 and 1.69. We would expect about 91 percent of the sample means to be within $0.08 of the population mean.