Download
1 / 17
170 likes | 174 Views
Statistical analysis and modeling of neural data Lecture 5. Bijan Pesaran 19 Sept, 2007. Goals. Recap last lecture – review Poisson process Give some point process examples to illustrate concepts. Characterize measures of association between observed sequences of events. Poisson process.

E N D
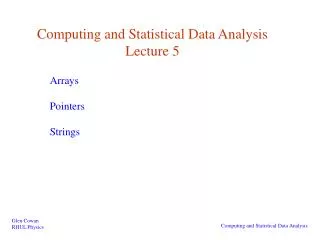
Statistical analysis and modeling of neural dataLecture 5 Bijan Pesaran 19 Sept, 2007
Goals • Recap last lecture – review Poisson process • Give some point process examples to illustrate concepts. • Characterize measures of association between observed sequences of events.
Renewal process • Independent intervals • Completely specified by interspike interval density • Convolution to get spike counts
Characterization of renewal process • Parametric: Model ISI density. • Choose density function, Gamma distribution: • Maximize likelihood of data No closed form. Use numerical procedure.
Characterization of renewal process • Non-parametric: Estimate ISI density • Select density estimator • Select smoothing parameter
Measures of association • Conditional probability • Auto-correlation and cross correlation • Spectrum and coherency • Joint peri-stimulus time histogram
Limitations of correlation • It is dimensional so its value depends on the units of measurement, number of events, binning. • It is not bounded, so no value indicates perfect linear relationship. • Statistical analysis assumes independent bins
Scaled correlation • This has no formal statistical interpretation!
Corrections to simple correlation • Covariations from response dynamics • Covariations from response latency • Covariations from response amplitude
Response dynamics • Shuffle corrected or shift predictor
Questions • Is association result of direct connection or common input • Is strength of association dependent on other inputs